We discover an extremely rare signal on 16th April 2021, that had occurred 4 times in the past 94 years since 1927.
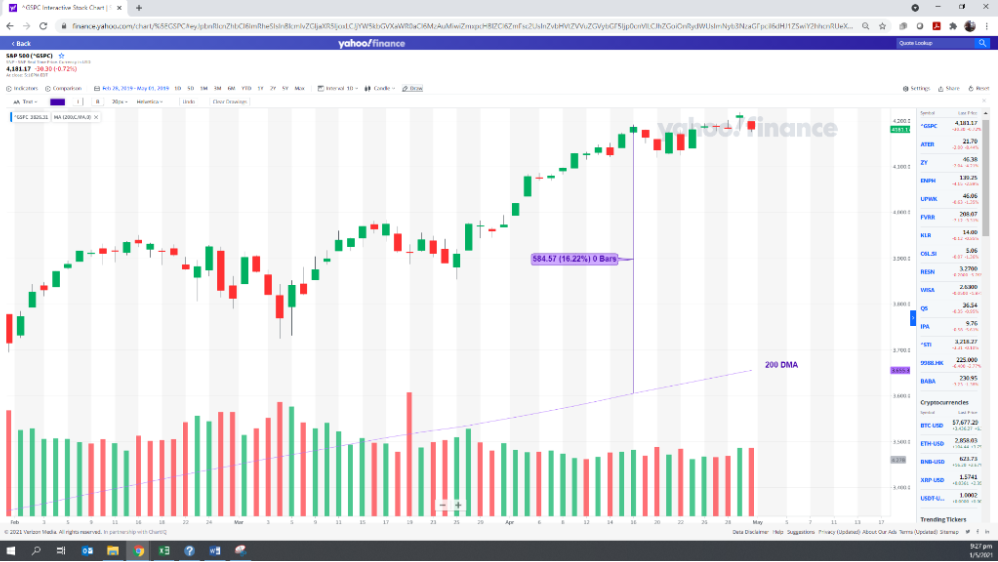
Historically, trading at 16% above 200 Daily Moving Average (DMA) of the S&P 500 is rare. And there are 18 trading days in which the S&P 500 traded at least 16% above the 200 DMA since the Covid lows. On 16th April 2021, the S&P 500 traded 16.22% above its 200 DMA.


There are two similar behaviours to this extremely rare signal that we observe:
- The S&P 500 must trade above the 200 DMA for at least 18 times
- Prior to this bullish behaviour, the S&P 500 must trade at least -26% below the 200 DMA
The significance of this study is to understand what history might say when the market moves from wildly bearish to a sustained bullish manner within a short period. Will markets continue to rally? Or will it collapse? Or do they perhaps take a breather?
TAKEAWAY
- Historically, being able to trade 16% above 200 Daily Moving Average (DMA) of the S&P 500, is rare. On 16th April 2021, the S&P 500 traded 16.22% above its 200 DMA. And there are 18 trading days in which the S&P 500 traded at least 16% above the 200 since the Covid lows.
- Historical evidence tells us when the S&P 500 trades 16% above its 200 DMA, for more than 18 times, on average, the risk begins to outweigh the rewards by a magnitude of almost 4x.
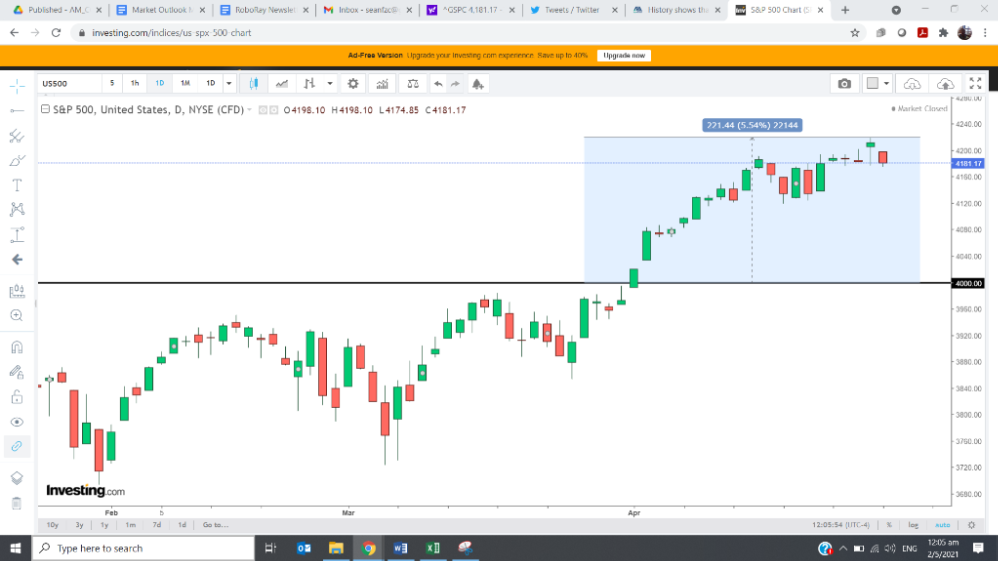
- On 1st April 2021, we had the historical milestone of breaking above 4,000 for the first time without revisiting the level. This behaviour occurred only at the 1,000 level marker. For that historical case, the S&P 500 rallied another 19% above the 1,000 level before the first retest occurred.
- As of 30th April 2021, we are currently 5.54% above the 4,000 level marker. This review highlights the possibility that another bullish run up like what had occurred at the 1,000 thousand level marker, cannot be ruled out.
- The S&P 500 is currently 400 days from the Covid-19 lows established on 23rd March 2020. No significant givebacks in the 400 days have occurred, and the rate of return (0.23%) is still within historical expectations. If no pullbacks occur by 12th May 2021 (413 days after recession lows), we will start to deviate from historical expectations.
Rare S&P 500 200 DMA Study Statistics

With reference to the above chart, since 1927, there had been five times (including the recent April 2021 case) where the S&P 500 went from trading -26% below the 200 DMA to trading at least 16% above the 200 DMA for at least 18 times.
These five unique instances occurred during:
- 1932 to 1933 after Great Depression
- 1937 to 1938 before World War II
- Recovery from 1975 recession
- Recovery from 2008-2009 Great Financial recession
- Recovery from Covid-19 pandemic
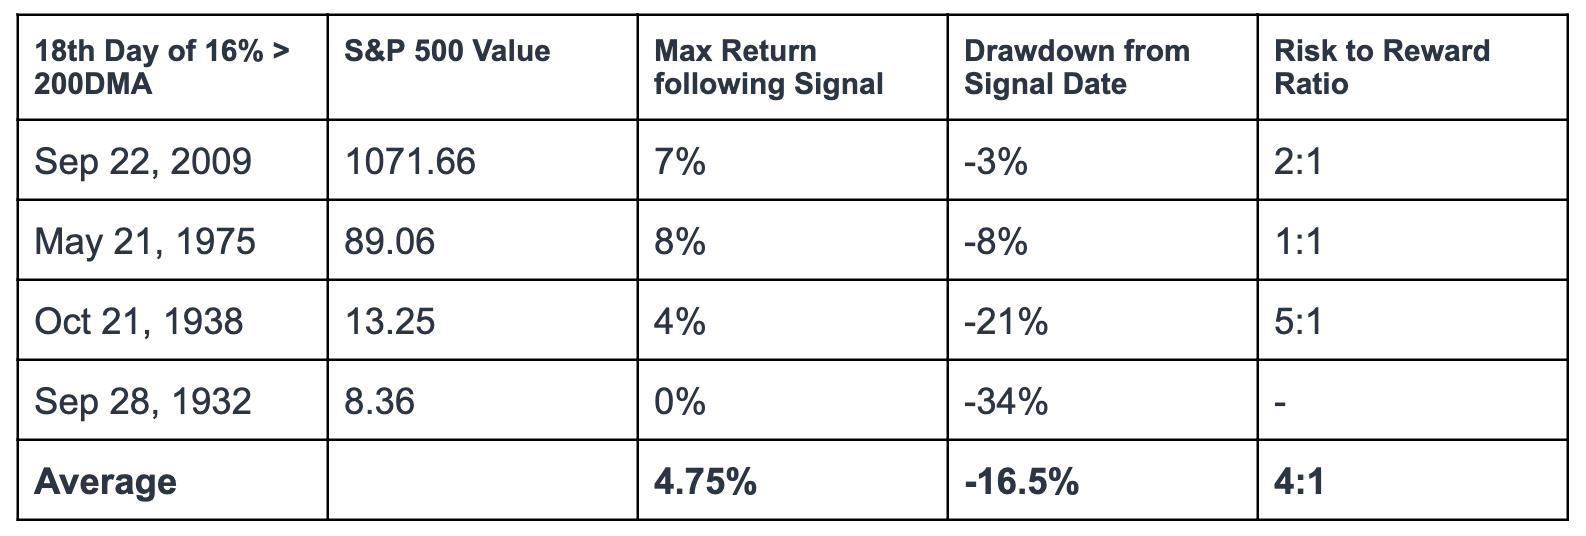
The market has proven in the previous four instances where such a rare signal had occurred, the rally of these recession lows was furious and strong. However, what we are now interested in is what history says about the market reward to risk behaviour going forward?
A summary of these is provided in the table below:

TAKEAWAY 1
Historical evidence tells us when the S&P 500 trades 16% above its 200 DMA, for more than 18 times, on average, the risk begins to outweigh the rewards by a magnitude of almost 4x.
1,000 level Marker Review
On 25th March 2021, we provided a historical study on how the S&P 500 had behaved around the thousand level marker.
In that article, we highlighted that the equities market has not been kind to traders and investors whenever the S&P 500 encountered the thousand level marker. History has shown that there have been mid-to long term consolidation phases at the S&P 500 1000, 2000 and 3000 price levels.

TAKEAWAY 2
On 1st April 2021, we had the historical milestone of breaking above 4,000 for the first time without revisiting the level.
On previous 2,000 and 3,000 level markers, not once did the S&P 500 clear these levels on the first attempt and held above it for 4 weeks.
This behaviour occurred only at the 1,000 level marker. For that historical case, the S&P 500 rallied another 19% above the 1,000 level before the first retest occurred.
As of 30th April 2021, we are currently 5.54% above the 4,000 level marker.
This review highlights the possibility that another bullish run up like what had occurred at the 1,000 thousand level marker, cannot be ruled out.
March 2021 Market Outlook Edition Review
In last month’s market outlook article, we aimed to answer the following question – what does market history tell us about the probability of its pullback, one year after a V-shaped rally off a recession low?
In that study, we highlighted that history tells us that when the rate of return was 0.20% or more, pullbacks occurred 100% of the time, and they occurred within 245 to 413 days after the recession lows.

TAKEAWAY 3
The S&P 500 is currently 400 days from the Covid-19 lows established on 23rd March 2020.
No significant givebacks in the 400 days have occurred, and the rate of return (0.23%) is still within historical expectations.
If no pullbacks occur by 12th May 2021 (413 days after recession lows), we will start to deviate from historical expectations.
Key Drivers of Equities Market Going Forward
Earnings Result
As of the end of April 2021, about 60% of S&P 500 companies have reported actual results for Q1 2021. 86% of these companies have reported actual EPS above estimates, and it is above the five-year average of 74%.
While earnings results have been stellar, these stocks have not rallied in the manner they used to, indicating that concerns over overextended stock valuations are beginning to weigh in investors’ minds.
According to JPMorgan’s John Norman, “Stock price reaction has been disappointing despite the strong beats. Misses are being penalized as per usual, and the beats are not translating into a positive stock price reaction.”
Chip Shortages and Production Costs
Many investors and analysts are increasingly concerned about rising commodities and raw material costs. This pushes higher companies’ production costs and erodes the margin. Alternatively, the company maintains the margin by increasing prices and passing on these costs to the customer. Both options will not be palatable to investors and analysts.
Globally there is a concern over semiconductor chip shortages. This is due to a strong chip demand, but supply and manufacturing cannot keep up. Many technology equipment companies that are heavily reliant on chips will likely suffer from the selldowns in the upcoming earnings announcement for the following reasons:
- Unable to meet demand due to chip supply pressures
- Likely to lower forward guidance and outlook due to supply uncertainties
- Delays in rolling out new products which will affect future expectations of revenue and growth
Inflation and Fed’s Reaction
The Fed’s recent announcement in April 2021 did not rock the boat very much. The Fed has assured markets they will continue their current stance of accommodative Fed policy and that discussions on tapering will only occur when economic data normalises.
That assurance was well received by the stock market and sent the S&P 500 to an all-time high at 4,218.78.
All present there are 2 scenarios that may cause the Fed to change their current stance, which may send shockwaves through the stock market should it occur:
- Economic data returns to pre-covid levels
- Higher than expected inflation occurs, resulting in the Fed having to prioritise inflation over economic recovery
At present, there have been leading indicators that suggest higher than expected inflation may occur. Many raw commodity prices such as lumber, copper, precious metals etc., have been accelerating at concerning rates. As a result, infrastructure and housing costs have also gone up in the US and globally. Inflation results should be carefully monitored going forward.
Biden Legislative Strategy
President Biden has proposed 2 key legislations. They are the American Jobs Plan and the American Families Plan. And if he manages to get them passed, it will mean more stimulus for the economy. These may be bullish for equities markets, as the American Families Plan is proposed to be worth $1.8 trillion of spending and tax cuts. However, the flip side to that Plan is the Biden Administration plans to increase top individual income tax, corporate tax, and capital gains tax for the wealthy. The key to how well supported the stock market will be is contingent on how negotiations go and whether actual tax changes stay within the consensus expectation.
1 Rate of Return is calculated via Total Rally Return (%) divided by the Total Rally Duration.
Conclusion
The most significant challenge for the equities market going into the second half of 2021, will be the market’s ability to keep up with the ‘perfect’ narrative. In the eyes of most investors and analysts, there is no doubt that based on the data on hand, things on the economic recovery front, earnings expectation and stock valuation, is probably as good as it gets.
Now’s probably a good time to remember that “The higher you go the harder you will fall”. Based on the historical studies we’ve conducted to date, the current market risk to reward behaviour is looking less and less favourable to the bulls.
To conclude, while we have identified scope and narratives that can continue to drive the market higher, in the grand scheme of things, it does appear it will take more to push markets higher and less for it to fall.
Disclaimer: Please note that all the information contained in this newsletter is intended for illustration and educational purposes only. It does not constitute any financial advice/recommendation to buy/sell any investment products or services.


