
INTRODUCTION
If you’re watching the current state of stock markets and wondering if it’s time to buy back into the market, or wish to short the rebound, take a moment to explore your options.
Shorting on the rebound can lead to unnecessary losses once markets bounce even higher.
Buying on rebound high can also lead to unnecessary losses should the recent markets bounce fail.
Consider these technical analysis of major indices, commodities, and risk assets from our expert analyst to take control of your trading positions when the global economic outlook isn’t so rosy.
Read on if you wish to know the key resistance and support levels for:
S&P 500
STI Index
Hang Seng Index
China A50
WTI Oil
Gold
Bitcoin
US Dollar Index
S&P 500 Index
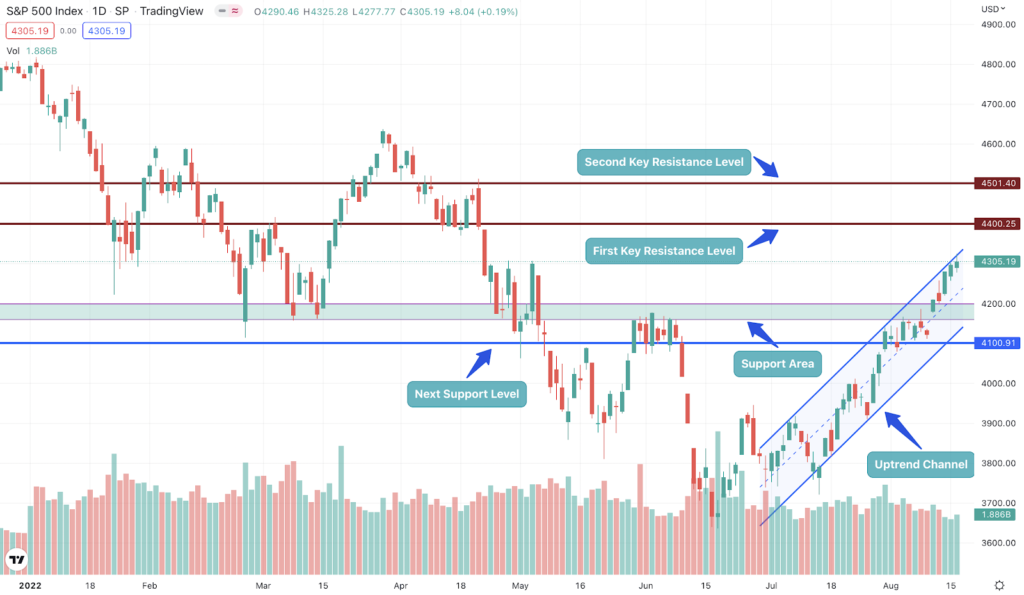
Key Resistance levels (bullish case):
Level 1: 4,370 – 4,420
Level 2: 4,475 – 4,525
Key Support levels (bearish case):
Level 1: 4,160 – 4,200
Level 2: 4,070 – 4,120
The S&P 500 index is currently on an upward momentum as it continues its sharp rally above the dreaded 4,000 price level. The short-term uptrend is intact; however, due to its parabolic nature to the upside, there is a high probability of an upcoming pause or sideways movement (consolidation) or pull-back (short-term correction) before it reaches its next key resistance level at around 4,400. Meanwhile, its nearest support area lies at around 4,170 – 4,200 levels.
STI Index
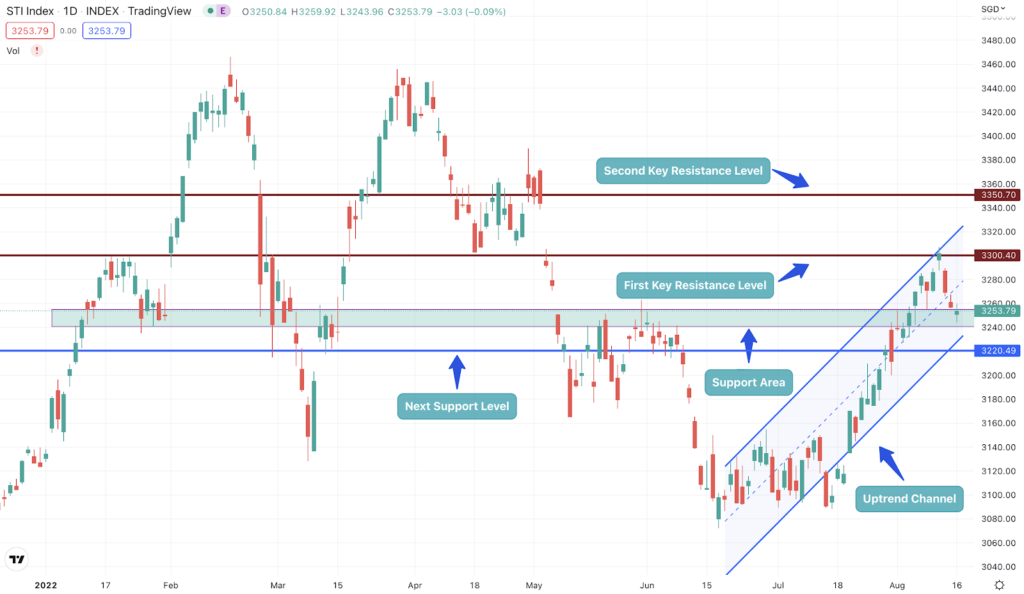
Key Resistance levels (bullish case):
Level 1: 3,285 – 3,315
Level 2: 3,335 – 3,360
Key Support levels (bearish case):
Level 1: 3,240 – 3,255
Level 2: 3,205 – 3,220
At first glance, the price action of the STI Index looks similar to that of the S&P 500. After it consolidated for a month at around 3,080 – 3,150, it broke out and had been rallying since. Currently, after hitting a key resistance level at 3,300, it has pulled back close to the lower channel line (support area).
However, upward momentum is still intact as it is more likely to continue its short-term uptrend and retest the 3,300 level. Based on its past price movement in the first half of the year, if it successfully closes above the first key resistance level, it will most likely encounter little resistance until the 3,350 level.
Hang Seng Index (HSI)
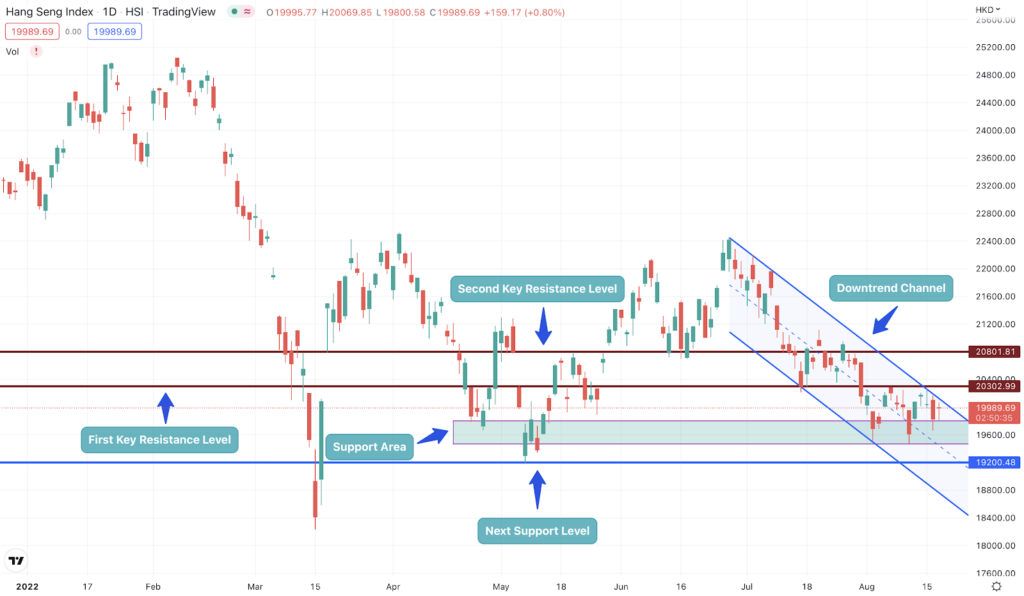
Key Resistance levels (bullish case):
Level 1: 20,250 – 20,350
Level 2: 20,750 – 20,850
Key Support levels (bearish case):
Level 1: 19,550 – 19,750
Level 2: 19,150 – 19,250
HSI is currently on a downward momentum as it establishes its downtrend channel. Looking at the macro price data this year, it is unlikely to close above the 20,300 level anytime soon. Instead, it seems like two likely predominant scenarios could unfold.
It will consolidate longer within the “Next Support Level” at around 19,200 and its “First Key Resistance Level” at 20,300, Or
It will continue its downward momentum upon breaking the next support level.
China A50
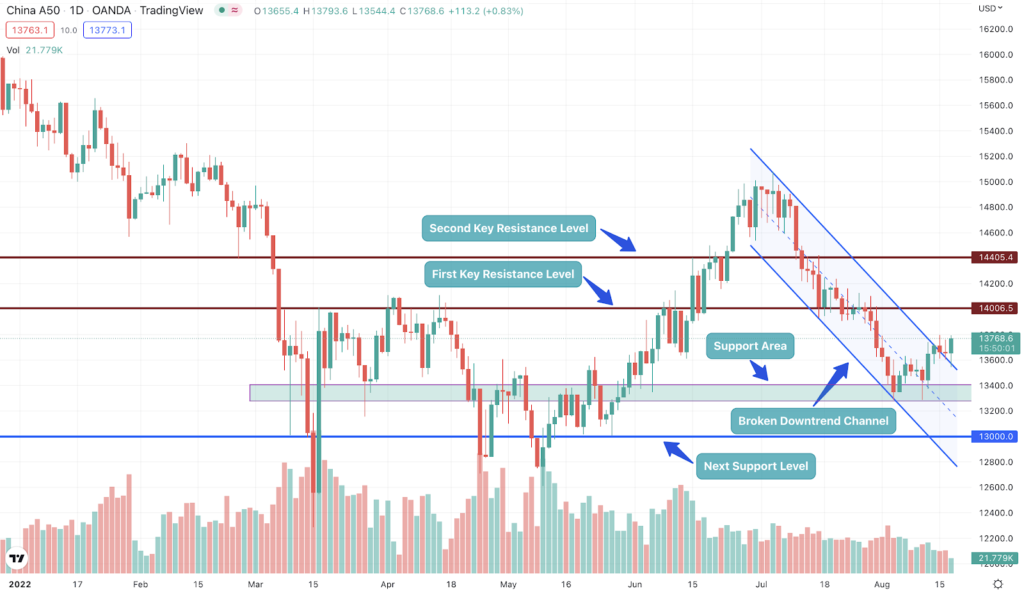
Key Resistance levels (bullish case):
Level 1: 13,950 – 14,050
Level 2: 14,350 – 14,450
Key Support levels (bearish case):
Level 1: 13,275 – 13,425
Level 2: 12,950 – 13,050
China A50 recently broke out from the upper line of its downtrend channel. However, it is still early to project whether this is just an overextension or the much-awaited shift in trend. However, looking at the recent price action (candlestick pattern and length) as well as the low volume for the past few days, it is more likely to consolidate in the short term as trade interest remains low and indecisive.
Nevertheless, the upper channel line (which previously served as a resistance line) will now serve as a running support level.
WTI Crude Oil
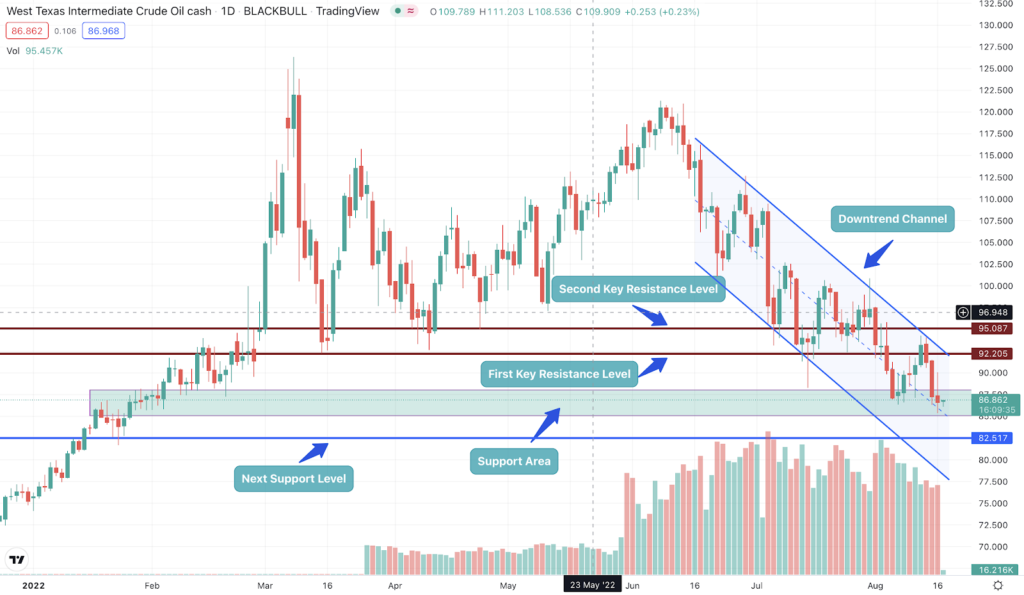
Key Resistance levels (bullish case):
Level 1: 91.20 – 92.80
Level 2: 94.70 – 95.90
Key Support levels (bearish case):
Level 1: 85.00 – 88.00
Level 2: 81.50 – 83.50
Since June, WTI has been exhibiting a classic downtrend pattern ─ lower highs and lower lows. Its downward channel is intact as momentum is on the downside. Based on its most recent price data, it will likely trade between the support area it is currently in and the upper channel line.
Volume has also been relatively high since it started to shift trend in early June, suggesting a strong sell-off/selling pressure to the downside. The next support level at around 82.5 provides a possible bounce level for a short consolidation/sideways movement to commence.
Gold
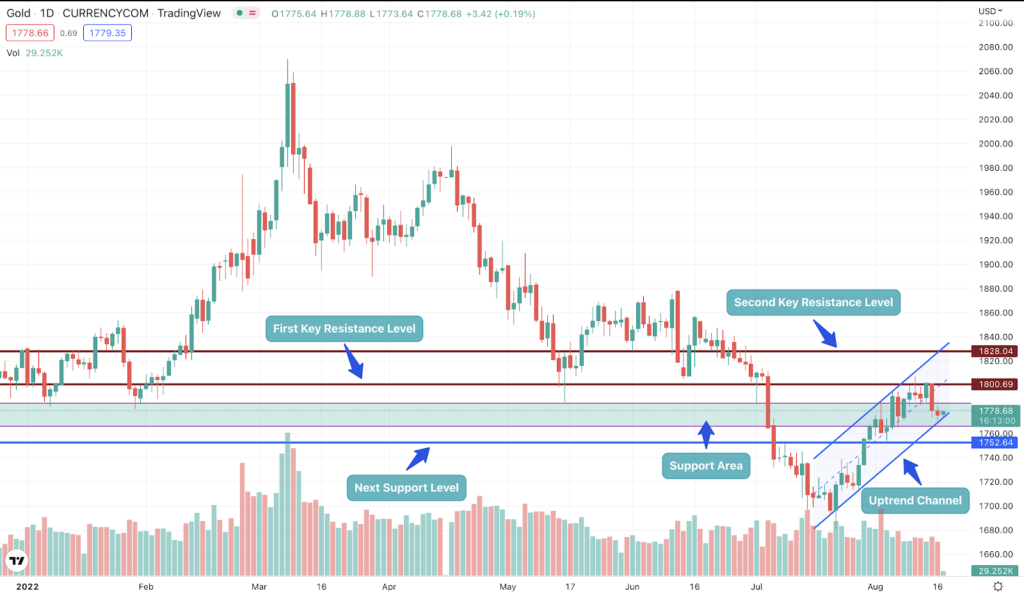
Key Resistance levels (bullish case):
Level 1: 1,795 – 1,805
Level 2: 1,825 – 1,840
Key Support levels (bearish case):
Level 1: 1,765 – 1,780
Level 2: 1,740 – 1,755
Since it hit a new Year-to-Date (YTD) low last month, Gold has been rallying past the 1,700 level and hitting its first key resistance level at 1,800. Currently, it has pulled back to the lower channel line. If it recovers and bounces back, it will then need to retest the 1,800 level and successfully break it to continue its momentum.
However, if it breaks below the lower channel line, it will most likely halt its upward momentum and start a consolidation period within 1,750 and 1,800 price levels.
Bitcoin (BTC)
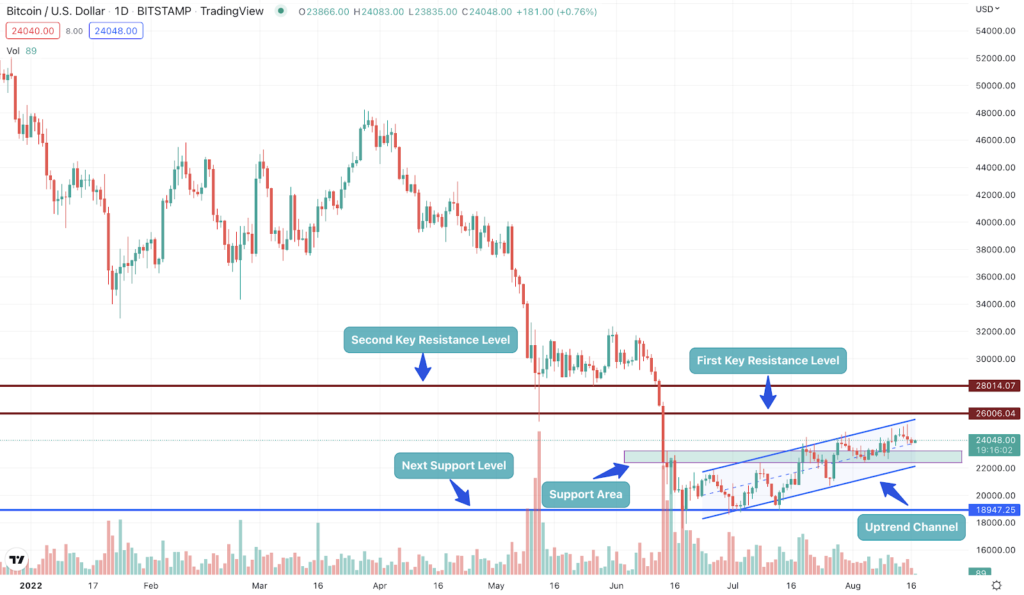
Key Resistance levels (bullish case):
Level 1: 25,700 – 26,200
Level 2: 28,000 – 28,500
Key Support levels (bearish case):
Level 1: 22,400 – 23,200
Level 2: 18,500 – 19,300
After a sharp parabolic decline in early June and piercing through the 18,000 level, BTC then started to consolidate for a brief period as it retested multiple times the 19,000 level. Currently, it has been on a relatively low uptrend momentum as its price action exhibits long wicks each time it closes higher, and volume remains average at best.
Therefore, expect a contention when it approaches its next key resistance level at around 26,000. On a macro level, BTC is still in an overall bearish condition until it closes the gap (25,000 to 28,000) it created during its sudden crash in the first half of June.
US Dollar Currency Index
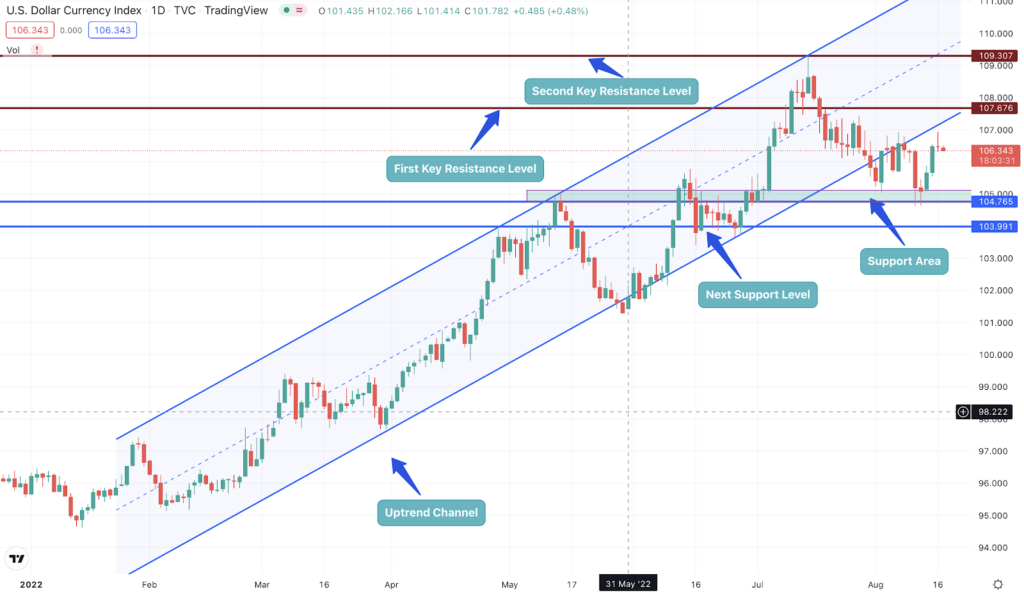
Key Resistance levels (bullish case):
Level 1: 107.50 – 108.00
Level 2: 109.00 – 109.30
Key Support levels (bearish case):
Level 1: 104.80 – 105.00
Level 2: 103.70 – 104.00
Lastly, the US dollar index maintains its strong upward momentum despite the recent correction from its high – piercing the 109 level. The uptrend channel and trend remain intact as the price recently bounced back from the support area. Hence, expect a continuation to the upside.
Nevertheless, the price might become choppy once it retests the 107.5 to 108 key resistance area. Macro-wise, the US dollar remains to be the strongest currency; thus, its price movement will most likely reflect this moving forward.
CONCLUSION
Out of 8 different securities we covered, five are on a predominantly upward momentum, while the other three are in a clear downward trajectory.
The US Dollar has been the strongest currency in the world and will most likely continue its upward movement.
US and Singapore Indices have recently begun rallying, together with Bitcoin as well as Gold.
Shanghai and Hong Kong indices have diverted from the world’s rising financial markets and instead exhibit a downward momentum.
Lastly, despite falling into the same commodity basket as Gold, Oil joins Chinese indices and has also been on a downward trajectory.
Please note that all the information contained in this newsletter is intended for illustration and educational purposes only. It does not constitute any financial advice/recommendation to buy/sell any investment products or services.


