Bear markets are most painful in real-time (rather than in hindsight), and this one hasn’t been an exception. 🐻
What makes this bear even worse is the breadth of negative returns. 🛑
From stocks to bonds, real estate to cryptocurrency, everything seems to be falling apart, and there is nowhere to hide.
Additionally, two consecutive quarters of negative GDP growth have sparked a heated debate over whether the U.S. economy is currently in a recession or not. 📉
Well, only time will tell if we indeed hit an official recession.
But if history is any guide, one of the hallmarks of bear markets is that they are sometimes associated with recessions.
And now, with another recession likely on the horizon, it is worth remembering that recessions are an inevitable part of a dynamic economy. And if you’re prepared for the next downturn, there will be plenty of opportunities when it ends. 💰📈
Therefore, the more you know about recessions, the better. Here are the top 7 must-know facts about recessions.
Definitions
A bear market is defined by a stock market return condition where the S&P 500 experienced a peak to trough drawdown of more than 20%.
A recession is defined by two consecutive quarters of negative GDP growth.
Most importantly, not all bear markets become recessions. However, historically all recessions have bear market behaviours.
Fact #1: No persistent yeild curve inversion was not followed by a recession
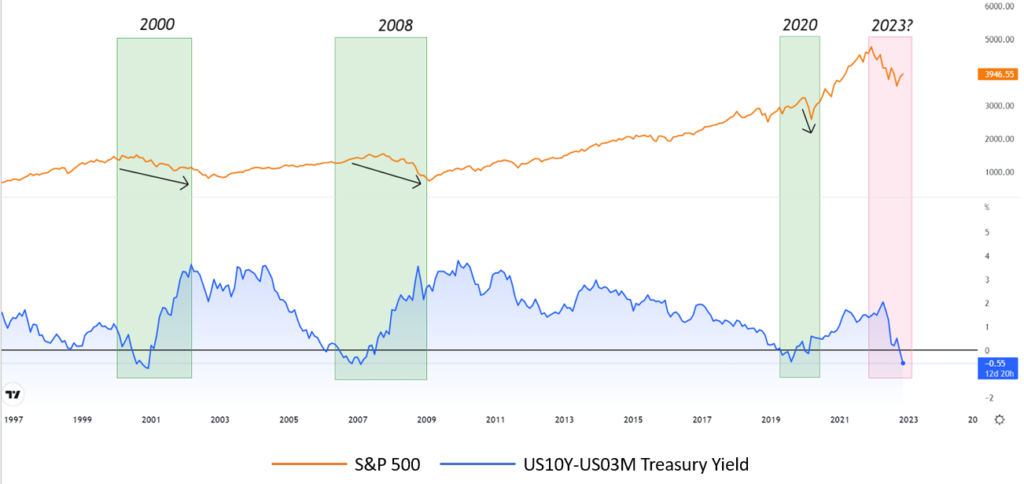
Let’s start with arguably the most important part of the post, which is the supposedly most accurate recession indicator – the inversion of the US 10Y yield to the 3M treasury yield.
The chart below indicates that whenever the yield curve inverts, meaning that the blue line in the chart dips below the 0% threshold, the economy soon goes into recession (indicated by the green columns).

And currently, it has again flashed a recession signal as it has inverted for the 4th time since 2000. Whenever this has happened, there has been a recession that followed.
Fact #2: No bear market recession in history ended before the recession occurred
Since the S&P 500 was established in 1957, there have been 10 official recessions in the U.S. The chart below shows how the index performed during those periods.

Unsurprisingly, the S&P 500 has always dropped during recessions, implying a 100% probability that no bear market recession in history ever ended before a recession occurred.
There are two important details about how the S&P 500 has performed during recessions:
First, in many cases, the index fell significantly well before the onset of the official recession.
Second, the S&P 500 often began to recover before the end of the recession.
Currently, though, after the S&P 500 rebounded more than 13% from its 2022 lows, a big question is raging in the financial markets:
Is this quick change of tack just a bear market rally or the beginning of a new bull market?
Well, considering the historical data, we should expect another leg down in markets if we indeed hit an official recession.
Fact #3: No bear market in history ended with Fed raising rates
Currently, the FED pivot/rate easing is among the most popular bullish narratives. And on the surface, it makes sense.
If the Fed pivots from hawkish to dovish monetary policy and aggressively cuts interest rates, it would indicate the Fed’s intent to reignite economic growth, which in turn, may boost the stock valuations.
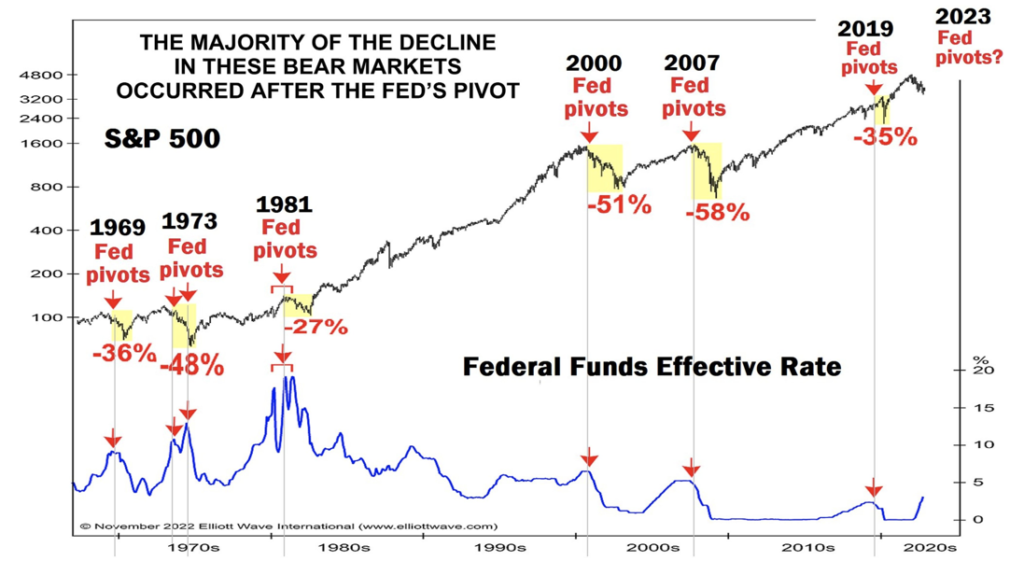
As seen in the chart below, historically, no recession-induced bear market in the S&P 500 bottomed with Fed raising rates.
Based on current expectation, the Fed has ways to go with the current fed fund rate of 3.75% to 4%.

Fact #4: Going From 75 Basis Point Hikes To 50 Basis Point Hikes Isn’t A Pivot
After 10 months of a brutal grind lower in the markets, it’s no surprise why investors are looking for any sign the selling may be over.
The ‘Fed pivot’ would be one such hope because it could signal that we’re getting closer to the end of this misery.
Initially, the market priced in the 75 bps rate hike for November 2022, and when the Fed signaled a lower rate hike of 50 bps for the December meeting, a majority of market participants considered it a Fed pivot.
However, a true pivot comes when the Fed indicates an end to the rate hiking cycle. Not even a rate cut, but a pause.
It needs to be something more concrete, something that the Fed has consistently failed to give up until this point.
Fact #5: During some recessions, S&P 500 declined after rate cuts
Historically, when the Fed enacted the first rate cut of an easing cycle, such was not the end of equity “bear markets,” but rather the beginning. This is illustrated in the chart below of previous “Fed pivots.”

Although rate cuts are almost always seen as a positive for equities, it usually takes several quarters for rate changes to have a tangible impact on the economy.
Fact #6: No bear-market ended with $SPX forward PE of ~18
The S&P 500’s forward price-to-earnings (P/E) ratio, a valuation indicator, has a solid track record of predicting the bear market bottoms.
In contrast to a traditional P/E ratio, which examines the trailing earnings over 12 months, a forward P/E ratio divides the value of a security (in this case, the value of the S&P 500 Index) by Wall Street’s consensus forecast earnings for the following fiscal year.
The S&P 500 has experienced several sizable pullbacks since the 90s, including:
- The dot-com bubble
- The 2008 housing market crisis
- The Covid-19 crash
The S&P 500’s forward P/E ratio has consistently found a bear market bottom between 13 and 14 over the past decade.
As of Friday, October 18, 2022, the S&P 500’s forward P/E ratio was 18.2.
If the history of the S&P 500’s Forward P/E ratio repeats itself, a significant decline in the forward P/E ratio is still required before this bear market reaches a trough.
Fact #7: No bear-market ended with $NDX forward PE of ~22
The Nasdaq 100 index has tumbled by over 35% in 2022 amid a severe sell-off in tech stocks, leaving many investors wondering whether tech stocks are a good bargain.
One way to gauge tech stock’s decline is to track how much valuations have contracted.
The Nasdaq’s forward P/E ratio for the current fiscal year has tumbled to 22 from 42 at the end of 2020, a 47% haircut.
Although that’s a big drop, it merely brings the $NDX in line with its historical average.
It declined to 13 during the 2008 financial crisis and hovered around 15 for much of 2011 and 2012.
There’s still a long way from where the Nasdaq’s forward PE currently trades.
It would have to drop an additional 40% to reach those levels!
If Q4 earnings come in weaker than expected, the fall would have to be even steeper for the Nasdaq to revisit its historical lows.
FINAL WORDS
Looking ahead to 2023, investors will focus on another key question: When will the Fed quit raising rates or even start cutting again?
- These questions will only be answered when we start to see a material drop in inflation and strong evidence of weakening economic data.
- Additionally, the 7 historically reliable indicators that we highlighted in this article, indicate this bear has more room to run.
- Fed policy, stock valuations, and economic conditions are still well below levels seen near previous bear market bottoms.
- Usually, markets don’t hit a durable bottom until pessimism is so deep and pervasive that nobody thinks there will be a bottom. A genuine bottom is a hopeless one where nobody is left to sell.
Please note that all the information contained in this newsletter is intended for illustration and educational purposes only. It does not constitute any financial advice/recommendation to buy/sell any investment products or services.


