Many traders find it challenging to achieve consistent profits with the MACD Crossover strategy. So, why do they struggle to succeed in the stock market using MACD? We are going to reveal a shocking truth about MACD Crossover.
The Moving Average Convergence Divergence (MACD) is a trend-following momentum indicator that shows the relationship between two moving averages of a security’s price. It consists of three components:
- MACD Line: The difference between the 12-day and 26-day exponential moving averages (EMAs).
- Signal Line: A 9-day EMA of the MACD Line.
- Histogram: The difference between the MACD Line and the Signal Line, visually representing the convergence or divergence of the two lines.

MACD Indicator
It is conventionally believed that:
- Bullish Signal: When the MACD Line crosses above the Signal Line, consider it a buy signal.
- Bearish Signal: When the MACD Line crosses below the Signal Line, consider it a sell signal.
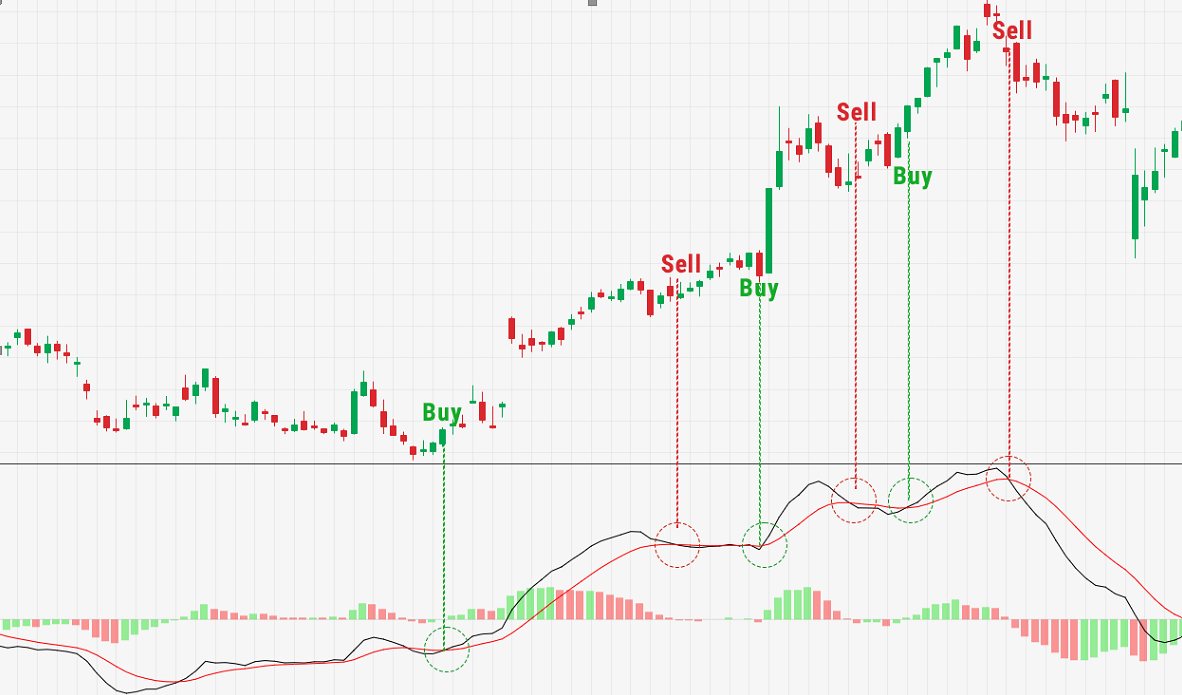
Regrettably, I must inform you that this strategy does not work, and I will demonstrate that the belief is generally unfounded. The MACD line crossover strategy, in fact, statistically lacks any predictive power concerning stock returns.
To reach this conclusion, I conducted two different experiments. These experiments involved analyzing about 500 major U.S. stocks from January 2010 to January 2024.
Let’s start with the experiment.
In the first experiment, we aim to determine whether a trader gains an advantage by using the MACD crossover to exit positions. I purchased every stock that generated a bullish signal and then exited the position either after N days [10, 20, 30, 40] or upon receiving a bearish signal.
The following tables provide you with various data like return per year, number of transactions per year, winning rate year, average return per transaction, average winning rate, and number of transactions, to provide a more comprehensive overview.
Table1. Exit 10 days later
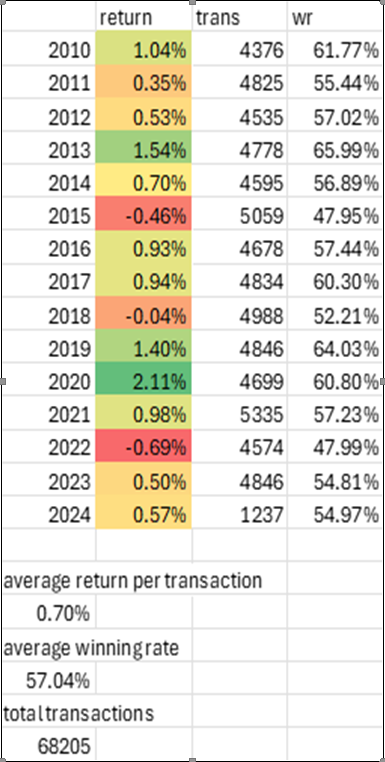
Table2. Exit 20 days later
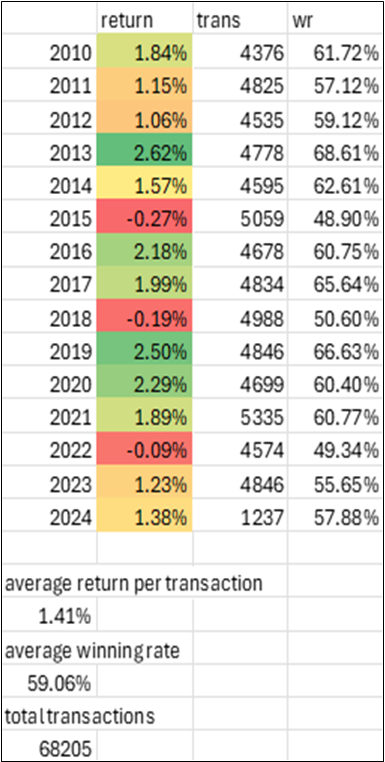
Table3. Exit 30 days later
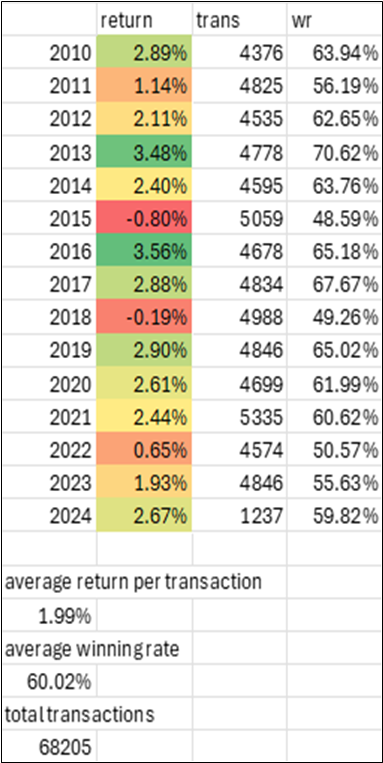
Table4. Exit 40 days later
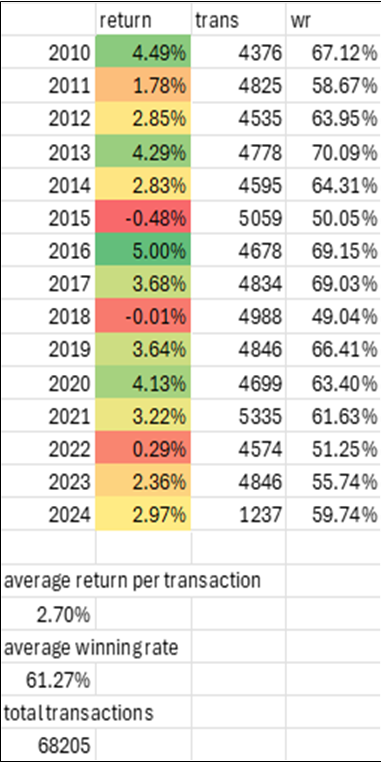
Table5. Exit based on MACD Crossover
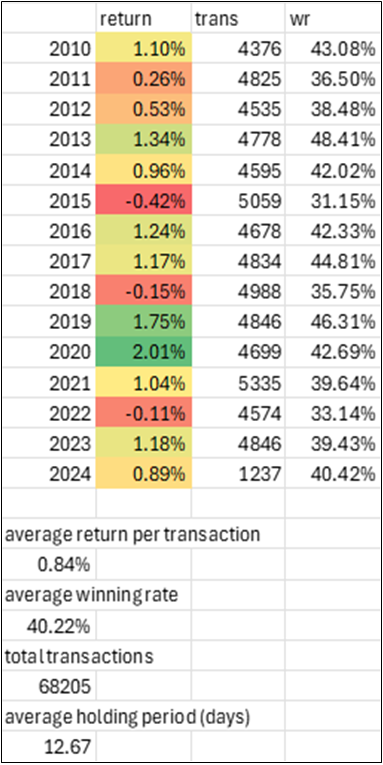
Summary: Evaluating MACD crossover performance using only Table 5 can be misleading. The results might suggest the strategy provides an advantage by delivering positive average returns per transaction. However, a deeper analysis shows that these returns may be driven more by the broader bullish trend in U.S. 500 stocks than by the MACD crossover itself.
In Experiment One, randomly selecting exit times outperformed relying on the MACD crossover for exit decisions. This trend becomes more pronounced when holding stocks for longer periods, particularly beyond 20 days (Tables 2, 3, and 4). This pattern is consistently observed in both the average return per transaction and the average win rate. Therefore, the MACD crossover strategy may not offer significant value when used to determine exit points.
Could timing entries with the MACD crossover be crucial in identifying stocks with a positive expected return?
To determine if the MACD crossover provides a superior entry signal, we can compare its performance to a strategy where positions are entered randomly and sold a few days later.
In the second experiment, our portfolio buys every stock from the 500 largest U.S. companies on each trading day and exits the position after N days [10, 20, 30, 40]. Given that there are 252 trading days in a year, the portfolio will make 252 purchases for each stock, holding each for N days before selling. Over a period of 14 years and with approximately 500 stocks, this results in about 1.7 million trades for each specified N exit day. Below is the performance table for buying stocks on a random date and selling them N days later.
Table6. Exit 10 days later
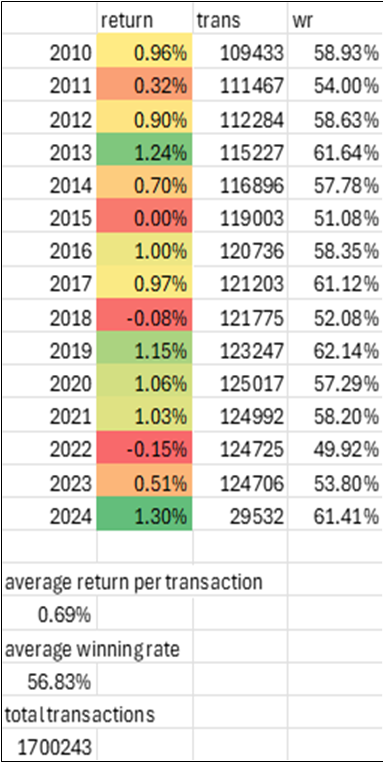
Table7. Exit 20 days later
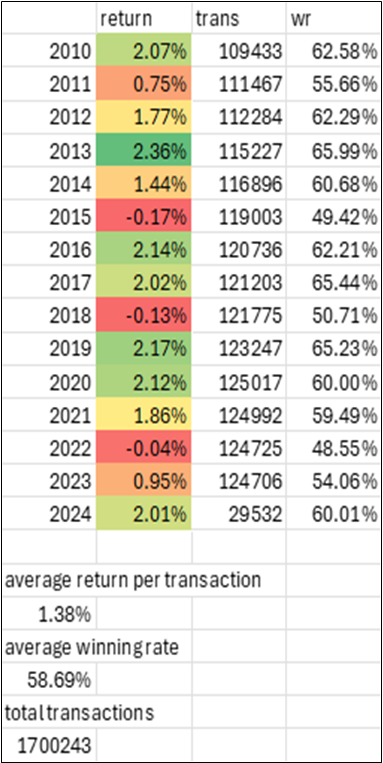
Table8. Exit 30 days later
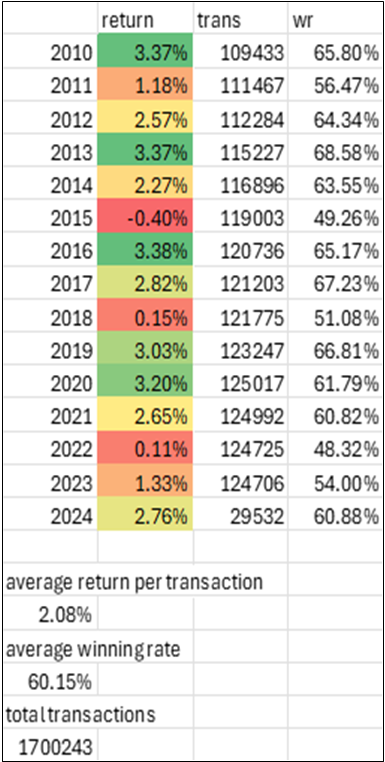
Table9. Exit 40 days later
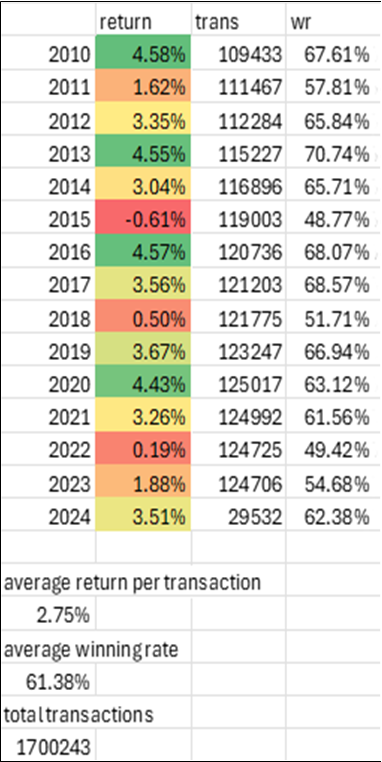
In the first experiment, we find that randomly selecting a selling date may result in higher average returns and a better winning rate, particularly as the holding period increases.
In the second experiment, it becomes evident that the MACD crossover entry also offers no real advantage to traders. This conclusion is drawn by comparing tables from experiment 2, which use random entries, with those from experiment 1, which use the MACD crossover entry, all within the same holding periods. A consistent pattern emerges: entering a position on a random date yields results nearly identical to those achieved with the MACD crossover. For example, comparing Table 7 to Table 2 reveals similar outcomes: an average return of 1.38% vs. 1.41% and a winning rate of 58.69% vs. 59.06%. Similar or identical performances are observed when comparing other tables, such as Table 6 vs. Table 1, Table 8 vs. Table 3, or Table 9 vs. Table 4. Do you see the point I’m making?
FINAL WORDS
By examining the data, you can gain a clearer understanding of the MACD crossover and whether it truly offers an advantage for profiting in the stock market. Unless you have a strong insight, if you find a crossover entry or exit opportunity that excites you, it’s wise to keep your expectations in check, as it may prove no more effective than buying and selling stocks at random times. So the next time you find it challenging to achieve consistent profits with the MACD Crossover strategy, you know why! Because it has no edge.
Please note that all the information contained in this letter is intended for illustration and educational purposes only. It does not constitute any financial advice/recommendation to buy/sell any investment products or services.


