U.S. stocks exhibited a mixed performance at the close of the latest trading session, as investors awaited the Federal Reserve’s minutes from its January meeting. Gains in sectors such as Telecoms, Technology, and Oil & Gas lifted the broader market, while declines in Healthcare, Consumer Goods, and Utilities contributed to the downturn in other areas.
The Dow Jones Industrial Average finished 0.37% lower, while the S&P 500 showed a marginal decline of 0.01%. Meanwhile, the NASDAQ Composite saw a 0.41% rise.

Source: Heritage Financial Consultants
Key trends included mixed sector movements, with technology and oil benefiting from investor confidence, while sectors like healthcare and consumer goods struggled. Additionally, market breadth revealed a modest lead for advancing stocks over decliners on major exchanges, with 1,412 stocks rising versus 1,364 declining on the New York Stock Exchange. The Nasdaq showed a similar trend, though the number of unchanged stocks remained relatively small.
In commodities, gold prices dipped 1.52%, while crude oil and Brent oil also posted modest declines, reflecting the mixed sentiment in energy markets. Meanwhile, the U.S. dollar showed slight depreciation against other major currencies, with the euro remaining stable.
Investor focus was largely driven by sectoral performance, with the CBOE Volatility Index, a key measure of market sentiment, declining to a one-month low, signaling reduced investor fear. The U.S. dollar index also saw a drop, contributing to a more subdued risk appetite.
International Issues
Fed Minutes and PMI Data Shape Market Outlook
The Federal Reserve’s minutes from its January meeting, set to be released on February 19, 2025, will be closely watched for any comments on the likely impact of President Trump’s plans for widespread trade tariffs. Purchasing managers’ data from the U.S., eurozone, and the U.K. could provide further evidence of a strong U.S. economy versus weaker economies in Europe.
In the U.S., the S&P provisional purchasing managers’ surveys on the manufacturing and services sectors in February will be released on February 21, providing a snapshot of economic performance. Other key data include housing starts for January, weekly jobless claims, and January existing home sales.

Source: Business Insider
In Europe, flash estimate purchasing manager indices for France, Germany, and the eurozone will be the data highlight, following January’s PMI improvements. Germany will hold elections on February 23, adding to the week’s significance.
In the U.K., key data include jobs data and consumer-price inflation figures, which could influence the Bank of England’s future rate decisions. The U.K. plans to sell ultra-long gilts, reflecting ongoing market activity.
Overall, the week ahead is packed with critical economic data and central bank decisions that will shape global financial markets, particularly in the context of ongoing trade tensions and inflationary pressures.
RBA Rate Cut, Asia’s Growth, and Trade Concerns
In Asia, central banks in Australia and New Zealand are expected to announce interest rate cuts, while Japan reports economic growth figures. The Reserve Bank of Australia (RBA) is likely to cut interest rates for the first time since 2020, aligning with global counterparts that have been cutting rates. Money market pricing suggests a 90% chance of a reduction in the official cash rate.
In Japan, gross domestic product figures are expected to show continued economic recovery, with real GDP expected to have increased 1.0% on an annual basis in the final quarter of 2024.
In China, focus remains on U.S. tariff announcements and Beijing’s responses, with house price data and loan prime rates being key indicators. The People’s Bank of China is expected to keep loan prime rates unchanged, despite ongoing deflationary pressures.

Source: New.com.au
In Southeast Asia, Indonesia’s central bank will announce its policy decision, with analysts divided on whether it will cut rates further. Thailand will release fourth-quarter GDP figures, which will show if the economy’s recovery has gained momentum.
Singapore’s 2025 budget, due on February 18, will be closely watched for measures to address cost-of-living challenges and support economic resilience. Malaysia will report trade and inflation figures, providing insight into the impact of U.S. tariffs and subsidy cuts.

Investment Opportunity & Risk
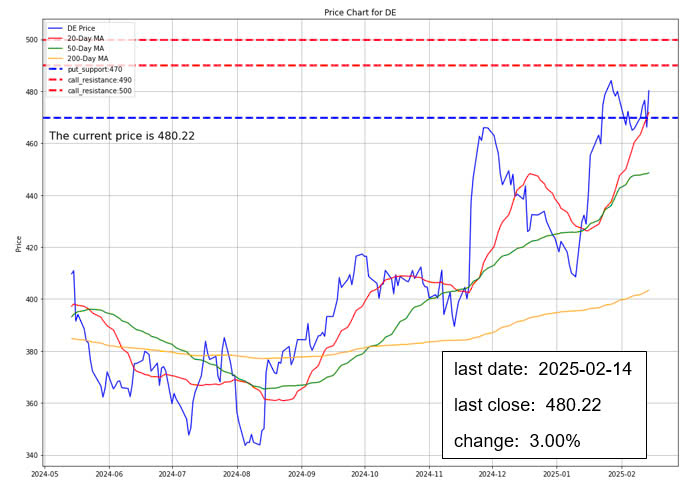
Deere (NYSE: DE)
Deere‘s fiscal first-quarter earnings and 2025 guidance were disappointing, with earnings per share of $3.19 on $6.8 billion in equipment sales, missing Wall Street expectations. However, a one-time tax benefit boosted results, and earnings were down from $6.23 per share on $10.5 billion in sales in the same quarter last year.
Despite a tough period for the farming industry, with lower farm incomes reducing spending on equipment, there is some optimism. The USDA projects a rebound in 2025 farm income, and Citi analyst Kyle Menges raised Deere’s price target, citing the belief that earnings have likely bottomed. Deere’s earnings are expected to improve by fiscal 2026, though analysts remain cautious, with 48% of them rating the stock as Buy. Deere’s stock rose 3% to $480.22 following earnings, and it trades at a high multiple relative to its projected 2025 earnings.
Option Smile Chart for DE
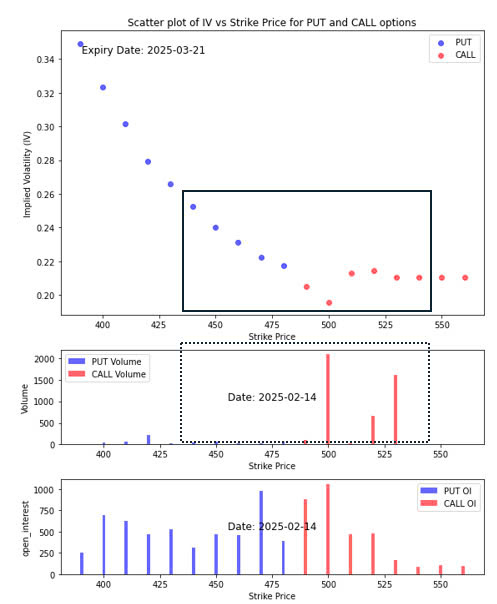
- Our in-house system assigns a bullish index score of 0.9 on a scale where 0 represents completely bearish and 1 represents completely bullish.
- The implied volatility of the put and call option around the stock price (ATM) shows that the average put option implied volatility is considerably larger that the average call option implied volatility. It is the sign that the fear for the drop in price is greater than the greed for the rise in price.
- On the other hand, the volume chart shows that close to the stock price (ATM), the volume of the call option is far greater than the volume of the put option. That signifies that despite the fear, traders are betting for the price of the stock to rise, specifically the net expectation is for the price to rise and surpass 500 and beyond.
- The open interest show that there is a major put induced support level at the strike price 470 and there are call induced resistance levels at 490 and 500.
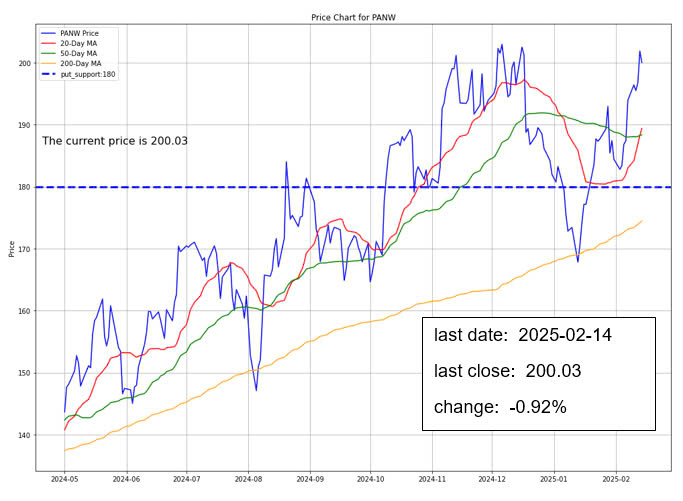
Palo Alto Networks' (NASDAQ:PANW)
On Friday, DA Davidson analyst Rudy Kessinger raised Palo Alto Networks’ (NASDAQ:PANW ) price target from 218 to 225, reaffirming a Buy rating, following the cybersecurity giant’s strong second-quarter fiscal results, which met or exceeded key metrics like Next-Generation Security (NGS) Annual Recurring Revenue (ARR) and Remaining Performance Obligations (RPOs). Despite Free Cash Flow (FCF) for the quarter falling below consensus, the company maintained its FCF margin guidance for fiscal year 2025 at 37-38% and extended its expectation of sustaining margins above 37% through fiscal year 2027.
Palo Alto Networks, valued at $126.4 billion, reported a robust gross profit margin of 74% and ~14% revenue growth over the last twelve months, earning a strong financial health score from InvestingPro. Kessinger highlighted strong channel feedback, robust demand for software firewalls, and stable hardware firewall demand, with Product Revenue exceeding expectations and growth projected to accelerate in the second half of the year. The company also raised its FY25 Operating Margin (OM) guidance by 50 basis points. Despite trading at a high P/E ratio of 45.4, DA Davidson remains bullish on the stock, citing solid performance and positive growth prospects.
Option Smile Chart for PANW
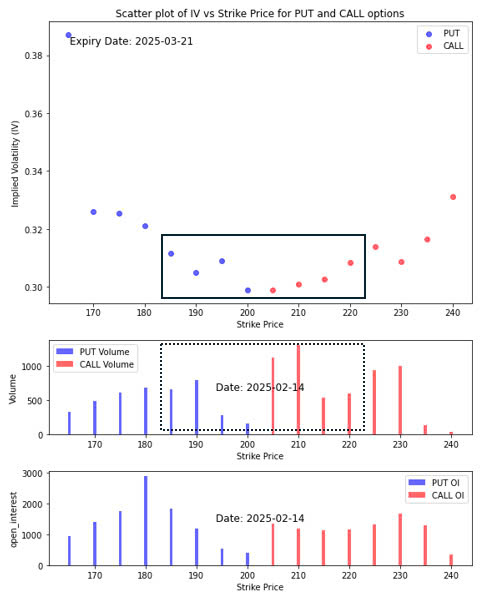
- Our in-house system assigns a bullish index score of 0.674 on a scale where 0 represents completely bearish and 1 represents completely bullish.
- The implied volatility of the put and call option around the stock price (ATM) shows that the average put and call option implied volatility are about equal. It is the sign that the fear for drop in price is about equal with the greed for the rise in price.
- On the other hand, the volume chart shows that close to the stock price (ATM), the volume of the call option is reasonably greater than the volume of the put option. That signifies that despite the parity between the fear and greed, traders are betting more for the price of the stock to rise, specifically the net expectation is for the price to rise and surpass 210 and beyond.
- The open interest shows that there is a major put induced support level at the strike price 180 and there is no major call induced resistance level. Please note that the relatively even distribution of the open interest across the strike prices indicates that any move down or up in prices may be self-sustaining.
Ralph Lauren (NYSE: RL)
UBS analysts reiterated their Buy rating on Ralph Lauren (NYSE: RL), maintaining a $348 price target, after a meeting with management on February 13th. The stock, currently trading at $281.70 near its 52-week high, has gained 59.36% over the past year. UBS is optimistic about Ralph Lauren’s potential to outperform, citing expected earnings per share (EPS) surprises that could lead to upward revisions in EPS estimates and an expansion of the P/E ratio.
The company’s strong brand image, distribution model changes, and impressive gross profit margins of 68.08S% position it to capture greater market share. UBS projects a 12% compound annual growth rate (CAGR) in EPS over the next five years, reinforcing their positive outlook. Other analysts have raised their price targets, with Needham setting it at $310, Telsey Advisory at $315, Jefferies at $330, and Barclays at $310, all reflecting growing confidence in Ralph Lauren’s sustained growth and successful business transformation.

Option Smile Chart for RL
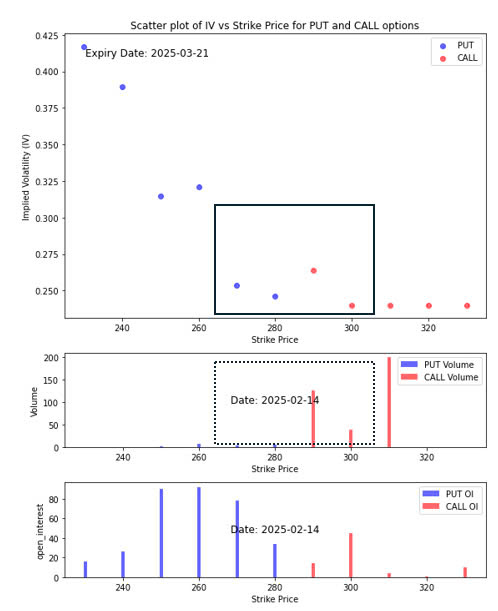
- Our in-house system assigns a bullish index score of 0.934 on a scale where 0 represents completely bearish and 1 represents completely bullish.
- The implied volatility of the put and call option around the stock price (ATM) shows that the average put and call option implied volatility are about equal. It is the sign that the fear for drop in price is about equal with the greed for the rise in price.
- On the other hand, the volume chart shows that close to the stock price (ATM), the volume of the call option is very much greater than the volume of the put option. That signifies that despite the parity between the fear and greed, traders are betting much more for the price of the stock to rise, specifically the net expectation is for the price to rise and surpass 290 and beyond.
- The open interest shows that there are multiple put induced support levels at the strike price 250, 260 and 270 and there is a minor call induced resistance level at 300 which from today’s sentiment appears to be surmountable. Please note that should the price level drop to the 270 support level, the delta hedging activity will most likely push the price further down.
CONCLUSION
- U.S. stocks showed mixed performance, with technology and energy sectors gaining while healthcare and consumer goods lagged.
- Investor sentiment remains cautious, indicated by a decline in the CBOE Volatility Index and a subdued risk appetite in currency markets.
- The release of the Federal Reserve’s January meeting minutes and key economic data (including PMI figures) will provide insights into the U.S. economy’s trajectory.
- Central bank decisions in Australia, New Zealand, and Europe, along with economic data from Asia, will influence global market dynamics.
- Ongoing trade tensions and inflationary pressures remain significant, making the coming week critical for investors and policymakers.
Please note that all information in this newsletter is for illustration and educational purposes only. It does not constitute financial advice or a recommendation to buy or sell any investment products or services.
About the Author

Rein Chua is the co-founder and Head of Training at AlgoMerchant. He has over 15 years of experience in cross-asset trading, portfolio management, and entrepreneurship. Major media outlets like Business Times, Yahoo News, and TechInAsia have featured him. Rein has spoken at financial institutions such as SGX, IDX, and ShareInvestor, sharing insights on the future of investing influenced by Artificial Intelligence and finance. He also founded the InvestPro Channel to educate traders and investors.
Rein Chua
Quant Trader, Investor, Financial Analyst, Vlogger, & Writer.