
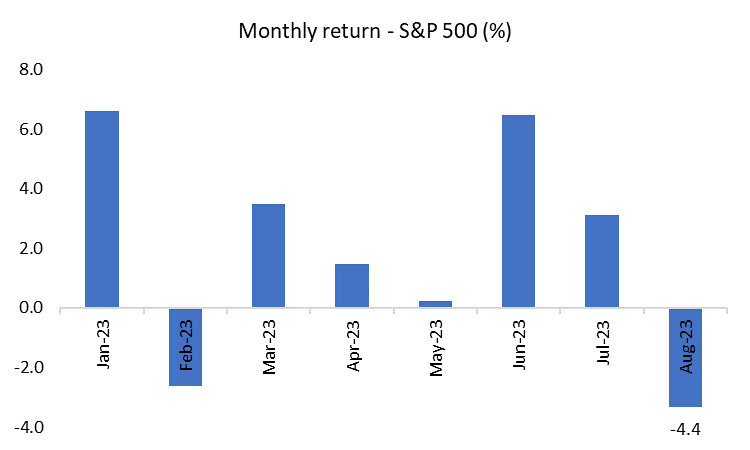
At the time of writing, year to date, the S&P 500 has seen a strong rally of 14.0%, although the performance across time and sectors has been uneven.
The impressive returns thus far exceed recent full-year gains of 2014 (13.7%) and 2016 (12%).
This is in sharp contrast to its nearly 20% drop in the previous year.
Since its low in October 2022, the S&P has rallied an incredible 22.1%, weathering the Fed’s hawkish moves, geopolitical tensions, and a host of other potential crises.
One of the key forces behind the stock market’s continued boom has been sky-high AI valuations and the belief of investors that these technologies will translate to improved decision-making, optimized business efficiencies, and generate greater business profits.
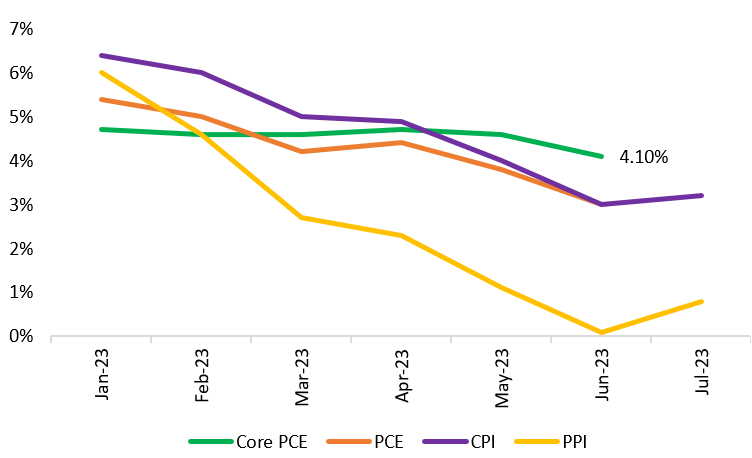
Much of the momentum in equities has also come from the sustained decline in inflation, with the CPI down to 3.2% YoY, compared to a staggering high of 9.1% in June 2022.
Similarly, in the most recent release, PCE had moderated to 3.0% YoY.
TL;DR
- The S&P 500 is up 14% YTD with equities recovering sharply from their slump last year.
- The S&P 500 has seen 5 consecutive months of positive returns between March and July 2023.
- However, in August, the index is down 4.4% thus far and seems on track to yield its first loss in six months.
- Investor sentiments have suffered due to mixed corporate earnings, instability in the banking system, elevated inflation, hawkish narratives, and concerns about monetary lags.
- NVIDIA’s Q2 results exceeded market expectations, but the S&P still lost ground, indicating a disconnect between AI developments and the aggregate index.
- The index is likely to see further downside due to higher interest rates, lower projected growth, the potential for contagion in the banking sector, and the uncertain impact of monetary lags.
- Market participants expect one to two additional rate hikes this year, with Governor Powell confirming at Jackson Hole that the Fed is ready to tighten policy further.
- The S&P 500 is susceptible to the downside today but will likely see support from excess savings until the end of the year.
- Investors should look to be cautious in the coming month and carefully assess the market’s reaction to Jerome Powell’s speech and other risk factors.
AUGUST 2023 DOWNSHIFT?
In the last 3 months, the S&P 500 is up 5.4%.
Despite these advances, and the strong rally between March and July, optimism in the US stock market may have begun to fracture in recent weeks, with growing concerns of a potential pullback.
Investor sentiment suddenly deteriorated, their confidence dented by fears of underperformance of corporate earnings, the potential for contagion in the banking system, the likelihood of additional rate hikes, and the possibility of the emergence of the monetary lagged effect.
As a result, at the time of writing, the S&P 500 was down 4.4% since its close on August 1st.
Barring an unlikely turnaround, the index is on track to post its first monthly decline since March 2023.
Source: S&P
This trend is in stark contrast to the general notion that September is often a profitable month for the exchange.
Instead, the August sell-off has pressured bullish sentiments and brought the bears to the fore.
The sea change in market attitudes was reflected in a leading investment survey, with bullish sentiments declining by nearly 17% in under a month.

Source: The AAII Investor Sentiment Survey
Bullish sentiment levels were down from a 1-year high of 51.4%, as recently as the 19th of July.
Continued jumps in the share of bearish views included a nearly 6% increase in this previous week.
NVIDIA and ai
One of the lingering anxieties around the current market situation has been the sheer degree of concentration of the bull run in AI and tech stocks.
During the first half of the year, 37% of total gains were concentrated in the top 10 stocks, of which 7 were from the technology sector.
NVIDIA has been the darling of the stock market this year with YTD gains of a whopping 215%.
However, much of what has propelled NVIDIA forward may be speculative expectations of future earnings, i.e., big funds and market makers relying on their assessments of what AI could deliver.
Last week, Todd Jones, CIO at Gratus Capital went as far as to say,
“I think almost nothing matters right now to market direction over the short term outside of these Nvidia earnings…”
He was referring to the much-awaited NVIDIA earnings report with projections of generating a mind-boggling revenue of $11 billion in Q2.
The report did not disappoint, with earnings surging to $13.5 billion, including a 141% increase in data-center sales.
Surprisingly, these better-than-expected results did not manage to dissuade investors from focusing on the gloomier macro-picture, with all eyes on Governor Jay Powell’s Friday speech at Jackson Hole.
Even though NVIDIA saw a 6.3% increase in the previous week, the S&P 500 fell nearly 60 points or 1.35% in Thursday trading to settle at 4,376.3, before posting a partial recovery before the weekend.
This appears to reflect the market’s falling confidence in the AI story or at least, a widening disconnect of technology leaders with the broader market over inflation, interest rates, financial stability, and growth.
The ‘Safe Haven Demand’ gauge of CNN’s Fear and Greed Index, pointed to ‘Extreme Fear’ being prevalent, having fallen from 6.45% on 24th July to -1.7% on 24th August.
This does not necessarily imply that the AI story is over, only that investors and traders realize that the profitable roll-out of these business models may not be so straightforward.
Companies will require vast amounts of time, data, and testing to ensure that outcomes are indeed reliable.
POTENTIAL DOWNSIDE FACTORS
Moving ahead, equities continue to face pressure from many sources.
CORPORATE EARNINGS MIXED BAG
A report by S&P 500 found that 2023 Q2 earnings had declined 3.8% YoY, while revenues were up 0.4% YoY.
These were calculated from blended earnings on August 11th, i.e., by combining the 91.2% of companies that had reported as well as estimates for the remaining.
On 21st August 2023, Yardeni.com estimated S&P 500 earnings to decline by 5.1% YoY.
This was opposed to the consensus view of -6.5% YoY.
The group also forecasted 2023 full-year earnings for the S&P 500 at $225.0, by which measure stocks are trading at a multiple of 19.6.
Such a handsome multiple, amid rising rates, a surprisingly robust labour market, and a projected slowdown in the rate of economic growth may have given traders pause for thought.
GROWTH ESTIMATES
IMF estimates for the United States suggest that a much weaker growth trajectory may lie ahead.
In its July 2023 update of the World Economic Outlook, the Fund projected full-year growth slowing to 1.8%, and 2024 showing an even deeper moderation to 1.0%.
This was against the 5.9% YoY recorded in 2021.
At the same time, global growth is expected to slow to 3% in both 2023 and 2024, against an estimate of 3.5% in 2022 and a full-year measure of 6.3% in 2021.
Further, the most recent S&P Global US Composite PMI, an important gauge of business activity for the economy, fell significantly short of forecasts of 52.0, registering a tepid expansion of 50.4 in August 2023.
BANKING CRISIS
Earlier this year, the US witnessed three of its four largest bank failures in history.
A run on the banks looked imminent and anxiety around the integrity of the regional banking system surged.
Given the fears of more banks collapsing, regulators such as the FDIC, Fed, and the Treasury Department, along with the support of interventions by certain players such as JP Morgan, managed to contain the crisis and allay fears of widespread contagion amid a deeply hawkish environment.
Yet, there remain concerns that the banking crisis was merely postponed.
With policy rates likely to head higher, lending conditions will tighten, while mounting unrealized losses, interbank lending conditions, and a slew of downgrades have kept the pressure on the banking system.
Citing ‘tough operating conditions’ and ‘potential risks in multiple areas,’ S&P Global Ratings downgraded 5 lenders as recently as last week.
These included Comerica and KeyBank, two of the US’s biggest names, while cumulatively, the five banks accounted for over $400 billion in assets.
A key risk here has been the exposure of banks to commercial real estate, with Newmark Group noting that US$1.2 trillion of debt in the sector may be under threat, due to high leverage, ballooning vacancy rates, and failing property values.
They estimate that banks could see $303 billion of ‘potentially troubled loans’ mature by 2025.
Source: KBW NASDAQ Bank Index
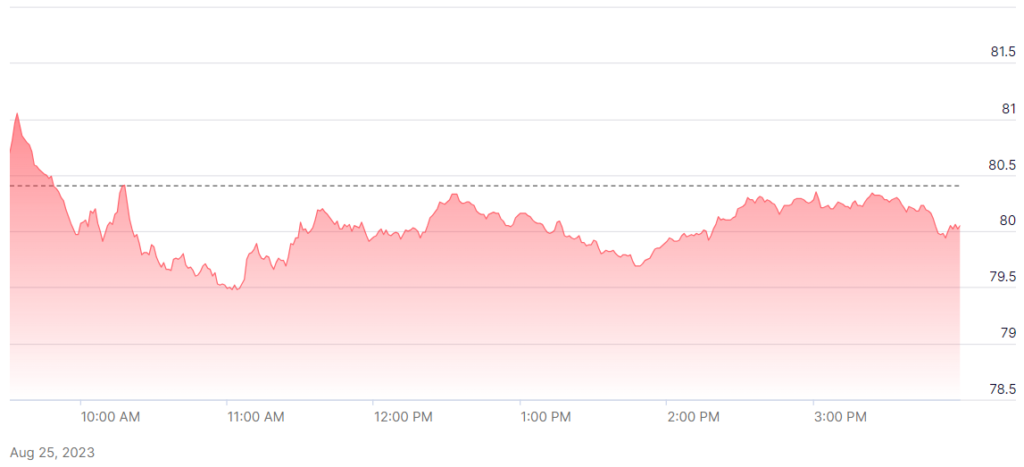
During the year, the KBW Bank Index (BKX) has declined from a high of 115.1 to 80.4, a steep fall of 30.1%, and is still struggling to stay above its March 2023 levels.
The gauge did show some resilience at the beginning of Q3 but has resumed its downtrend.
In such an environment, banks may be forced to liquidate CRE holdings under duress which will likely prove to be a significant drag on equities.
INFLATION AND INTEREST RATES
The key factor for the US economy remains the policy rate.
In Governor Powell’s highly anticipated Jackson Hole address, he kept the pressure firmly on markets, restating that inflation is well above the 2% target and that the FOMC is “prepared to raise rates further.”
Although inflation has continued to decline, the Fed is unlikely to cut rates any time soon and acknowledged the risks of both doing too much and too little.
Source: US BEA, US BLS
The Fed’s preferred inflation gauge, the core PCE, stands at 4.1%, double the stated 2% target, despite 11 rate hikes since March 2022, including 6 supersized increments.
A growing segment of commentators such as Peter Schiff, CEO and chief global strategist of Euro Pacific Capital, attribute the moderation in inflation to other factors such as the earlier fall in oil prices, and believe that an inflation reversal may be in store.
Sticky core inflation is certainly a cause for concern and has persisted largely due to the severe housing shortage. In addition, a recent Fannie Mae survey found that 82% of respondents felt it was the wrong time to buy a home due to high mortgage rates.
However, the strained inventory is likely to moderate any downside, meaning that core inflation will continue to persist.
According to the CME FedWatch Tool, a gauge to forecast the probabilities of further rate changes, there is a 15.5% chance of a 25-bps hike to 5.5% – 5.75% in the September 20th meeting.
However, this rises to 44.5% for the November 1st meeting, with an additional 6.5% chance of a rise to 5.75% – 6.0%. Thus, there is essentially a 51% probability that rates will be hiked in the November meeting.
In the December prediction, there is also a highly improbable 2.1% chance of a rate cut before the end of the year.
As rates head higher, shaky liquidity and the potential for a weakening labour market could exacerbate the crisis, and weigh on the stock market at least in the coming month.
In addition, at Jackson Hole, Powell noted that earlier rate hikes may be still working themselves through the system, signalling that he expects monetary lags to play a role in slowing the economy.
MONETARY LAGS
With market participants expecting rates to increase by at least a quarter per cent, or perhaps half a per cent by the end of this year, and the labour market staying intact, there are mounting concerns that the ‘lagged effect’ of accumulated interest hikes has not yet played out.
Apollo Global Management chief economist, Torsten Slok, noted earlier this week, that consumer spending and repayments by both consumers and corporates should be expected to slow down, particularly as savings are extinguished and student loan repayments re-commence.
With core inflation at 4.7% and the Atlanta GDPNow forecasting quarterly growth at nearly an incredible 6%, Slok believes that despite the tough rhetoric, the Fed is in fact slowing down due to the unpredictable impacts of variable lags.
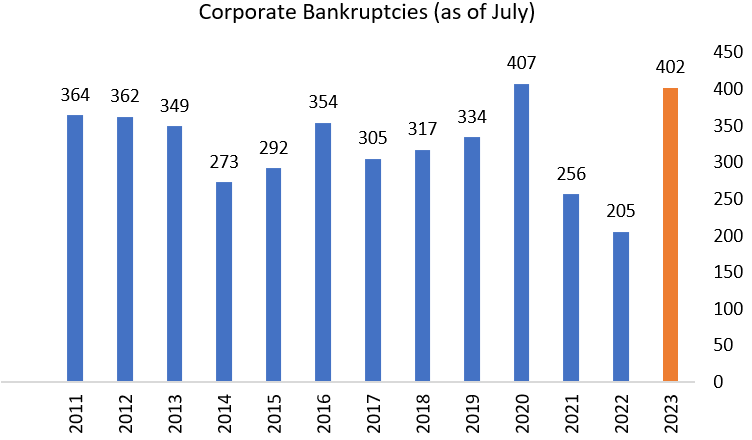
An indication of the impact of lags may be visible in the sheer number of corporate bankruptcies as of July this year.
Source: Visual Capitalist
In 2010, there were 530 bankruptcies by July, an exceptionally high number in the wake of the GFC.
Investors may wish to heed Slok’s advice and watch for indications of a larger pullback.
With hostilities still playing out in Ukraine, deflation in China, and brewing turmoil vis-à-vis the potential for war in Taiwan, equities may be exposed to unforeseen shocks.
EXCESS SAVINGS AND BOND YIELDS
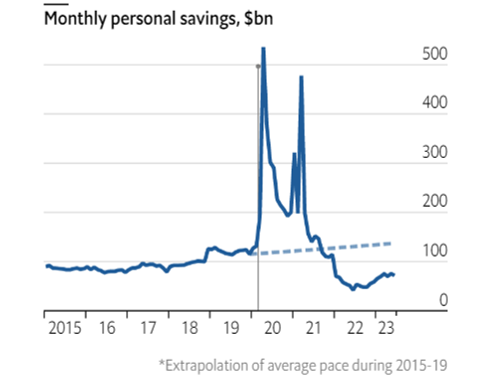
Equities and spending have remained surprisingly robust, but a recent study by the San Francisco Fed finds that the cushion of pandemic-era accumulated savings of $2.1 trillion has dwindled to $500 bn.
Even so, the SF Fed expects the economy to be supported by these savings till Q4 2023 but concedes that their distribution is unknown.
As a result, the S&P 500 may continue upon a more-bullish-than-not path till the end of this year but may see the negative effects of slower consumption in 2024.
At the same time, 10-year yields have begun to shift even higher with Michael Craig, Head of Asset Allocation at TD Asset Management, arguing that this is because sizable short positions have been taken on US treasuries.
In addition, the US has elected to issue more bonds than expected to finance its debt burden.
This comes shortly after the US’s credit rating was downgraded with yields potentially geared to grind higher.
DOWNSIDE OBJECTIVES WITH TECHNICAL ANALYSIS
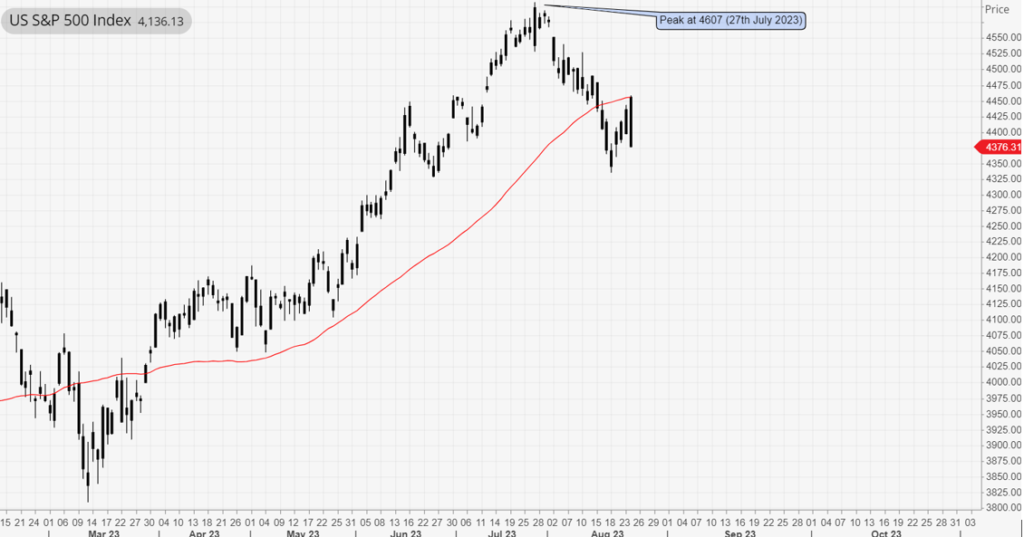
The first thing we note when looking at the chart is that after a significant bull run, the market has pulled back meaningfully from its highs.
Specifically, the market is trailing its 50-day moving average, which signals a bearish trend and room for significant correction.
In Thursday’s trading session, on the 24th of August, the market ended 1.35% lower at 4376.31.
Source: Algomerchant
In this situation, how low can the market go?
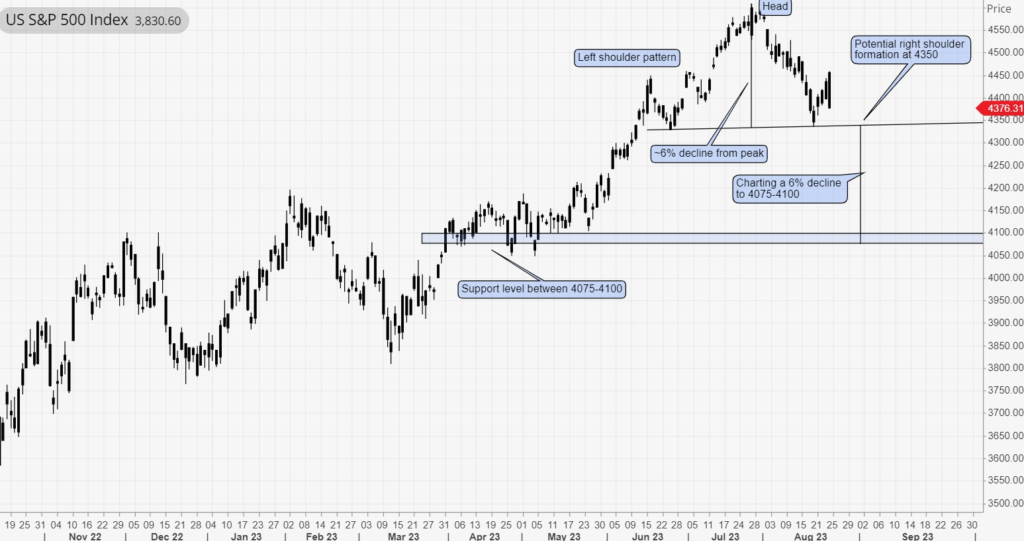
Firstly, we can consider a head and shoulders pattern, which is often considered a very reliable indicator of potential trend reversal.
Do note that a head and shoulders pattern has not formed yet.
We are making the assumption that it could emerge, to help us identify potential support levels.
In the graph below, we can see that the left shoulder has already formed, and the peak is shaped like a head structure.
The right shoulder is not yet visible, but we could potentially be on track to see this at about 4350 levels, which if the trend holds, may appear in about another week.
Source: Algomerchant
The distance from the peak to 4,350 (our assumed target for the right shoulder to form) is about 6%.
If the index breaches this level in a similar time frame, we can project a further 6% decline from this key level, which would bring our price target to 4075 – 4100 levels.
Interestingly, this is supported by the April and May lows, yielding a potential downside target.
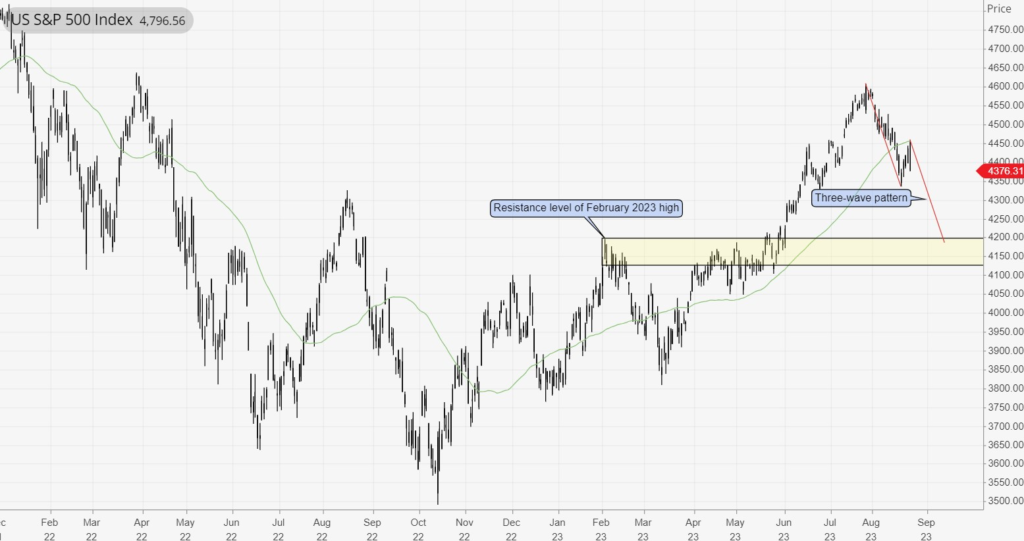
A second approach that we could take is by using a three-wave pattern, flat pattern, or ABC correction, which is the idea that the bearish market movement occurs in three phases.
In the first phase, the market sees a sharp and unexpected dip.
This prompts participants to defend their positions, leading to a bump in price, and finally giving way to a third phase and achieving a new low.
We can see that this zigzag pattern may be emerging in the case of the S&P 500.
Source: Algomerchant
We duplicate the first impulse wave from the peak to the new low, after the second wave (or bounce) which appears to have materialized post the NVIDIA results.
The third wave (equivalent in length and parallel to the first wave) identifies a potential price point at around 4200.
This formed an important resistance level in February 2023 and in April-May 2023, suggesting that this could become a floor for the index, sometime in September-October.
As reinforcement for the above finding, we see that the trend line from the October 2022 low through the March 2023 low, extends out to 4200 levels, suggesting that the downside price swings may fall to this level.
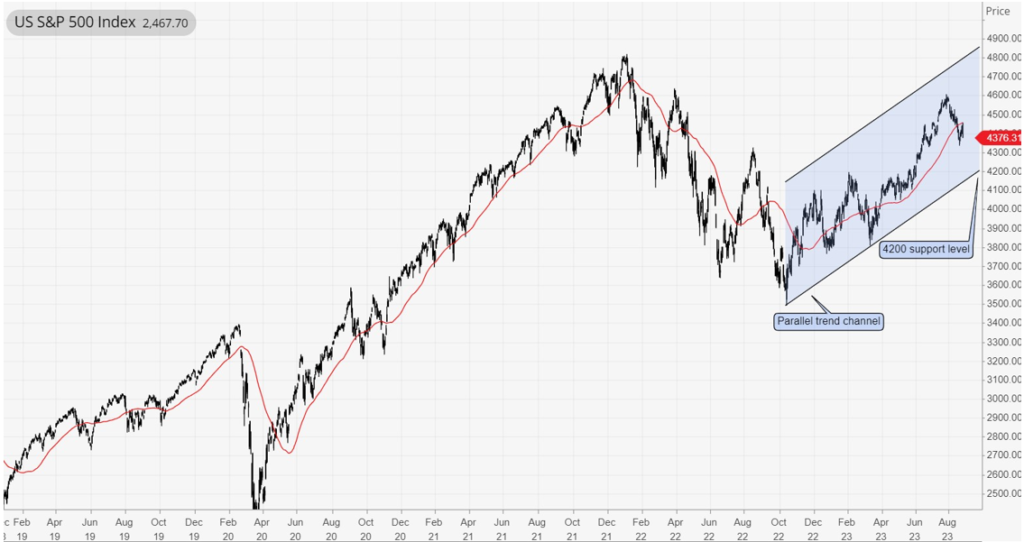
Source: Algomerchant
From the above charts, it is likely that the S&P 500 may contract further, finding support at 4200 or lower at 4075 – 4100, in the coming weeks.
However, if the index breaks below 4075, we could be looking at a more significant downturn, reaching at least 4000.
THE BULL CASE
On the flipside, John Stoltzfus, Chief Investment Strategist at Oppenheimer Asset Management, is highly bullish on the market, believing that higher rates are a normalization of policy, which will only help usher in a sustainable recovery.
He believes that the correction in the S&P 500 has been a healthy consolidation in a wider bull run, with resilient stocks now looking to head higher on the back of a robust labour market and strong consumer spending.
His target for the S&P 500 is to reach 4,900 by the end of the year.
In addition, consensus projections of earnings in Q4 stand at 8.7%+ YoY, adding credibility to Stoltzfus’s optimism, and paving the way for the resumption of the bull run.
Although equities are likely to continue their uptrend, the coming month may prove choppy and investors may wish to tread cautiously.
outlook
Despite the strong bull run this year, the S&P 500 has seen a pullback in the past month.
Bearish sentiments of investors and technical analysis would suggest that the decline may continue in the coming month and reach 4075 – 4100 to 4200 levels.
The key takeaway is that the Federal Reserve has doubled down on its hawkish narratives.
Sticky inflation is clearly still at a considerable distance from the target level, which shall keep rates from being cut in the near term.
Even though rates are unlikely to see a decline prior to 2024, if such a scenario does occur pre-maturely, this could potentially spook the market and be interpreted as a signal that monetary lags are leading to severe weakness and may result in a decline to 4,000 levels or lower.
Coupled with the heavy concentration of AI-related optimism, investors may prefer to be watchful in such a scenario, and closely track developments in the banking sector as well as be mindful of weakness in the labour market and consumer spending.
Investors will be served well by maintaining a prudent wait-and-watch strategy at this time, particularly given Governor Powell’s latest comments.
However, excess savings in the economy shall likely allow the market to resume an upward phase before the end of the year.
FINAL WORDS
With the S&P 500 being poised for a month-on-month loss for the first time in six months, investors should proceed with caution.
Even though NVIDIA’s results exceeded expectations, the market lost ground, highlighting the role of other concerns beyond AI.
The Fed stands ready to tighten rates further and may do so once or twice more in 2023.
The Fed is unlikely to cut back on rates before at least Q1-Q2 2024.
- In the coming month, the market could potentially see losses and is likely to decline to at least 4,200 levels.
- Any potential losses in the stock market in the coming month may be countered by a deep well of excess savings.
- However, studies show that pandemic-era savings are dwindling too.
- An important trend to watch out for is the delayed impact of monetary lags and the possible consequences for the economy in the coming months.


