Introduction
On March 28th, the 5-year and 30-year Treasury yield curves inverted for the first time since 2006. Following that, the 5-year and 10-year Treasury yield curves, as well as the 2-year and 5-year Treasury yield curves, inverted.
But why does Wall Street pay so much attention to the yield curve inversions?
Simply put, the reason investors watch the yield curve inversion so closely is that it has been an incredibly accurate predictor of recessions. Almost every time the yield curve is inverted, the economy eventually goes into recession.
But, what does it mean for us as investors? Should we run and sell our stocks or should we stay the course?
But first, let's start by understanding The Bigger Picture What Are These Yield Curves?
The yield curve is just a graph that depicts the relationship between short- and long-term interest rates on fixed-income instruments like US Treasury bonds.
Usually, yields (returns) for longer-term bonds tend to be higher than yields for shorter-term bonds as investors demand extra compensation for the risk associated with their longer-term investments.
Long term yields = Short term yields + Premium for Risk and Duration.

This relationship, however, does not always remain the same. When the long-term rate falls below the short-term rate, the “inverted yield curve” occurs.
It usually reflects that the long-term rates are likely to fall due to an impending slowdown in economic activity, and it’s usually interpreted as an indication of an upcoming recession.

Why does this matter?
It commands so much attention because of the single most significant question: whether the yield curve inversion leads to a recession?
Many economists and Wall Street analysts tend to watch the relationship between the 2-year and 10-year Treasury yields for clues to whether the bond market is worried about an economic downturn.
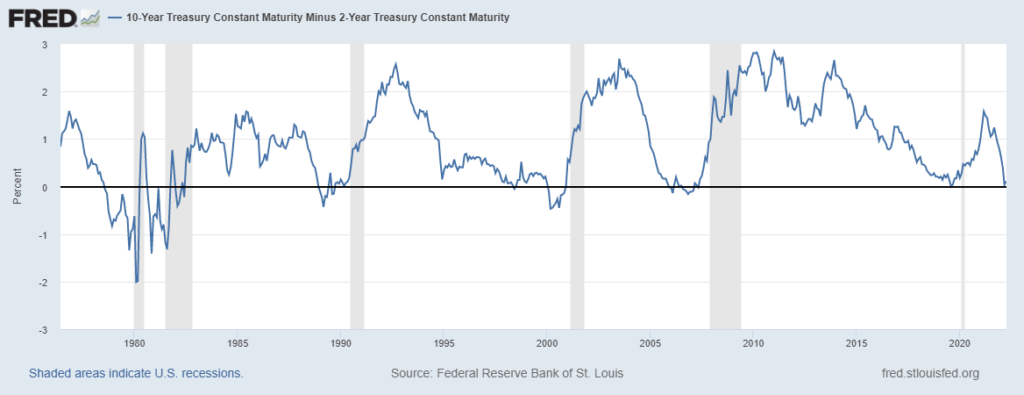
The yield curve’s predictive power can be seen in the graph below, where a crossover below the black line indicates an inverted yield curve, and the grey areas represent recessions that occur after a short time lag of 1 to 2 years.

Source: FRED
According to MUFG Securities, the yield curve inverted 422 days before the 2001 recession, 571 days before the 2007-2009 recession, and 163 days before the 2020 recession.
With the exception of 1998, whenever the 10-year yield falls below the 2-year yield (inversion), there is a greater than 67% likelihood that the US will enter a recession in the next 12 months and a greater than 98% probability that the US will enter a recession in the next 24 months.
Other market analysts, including Federal Reserve officials, believe the correlation between the 3-month and 2-year treasuries is more significant. An inversion of the yield curve between the 3-month and 2-year Treasurys has preceded every recession in the last 60 years, indicating a 100% probability.
As the 2-year and 10-year Treasury yields also inverted recently in 2022 following the last inversion in 2019, many pundits are sending a possible warning signal that a recession could be on the horizon.
So, will we repeat history or will things be different this time?
If history repeats itself, we will enter a recession, but there are reasons to believe that things may be different this time.
As we have discussed, the correlation between 3-month and 2-year bond yields is a more reliable predictor of recession. And to date, the yield curve from 3-month to 2-year has not inverted.

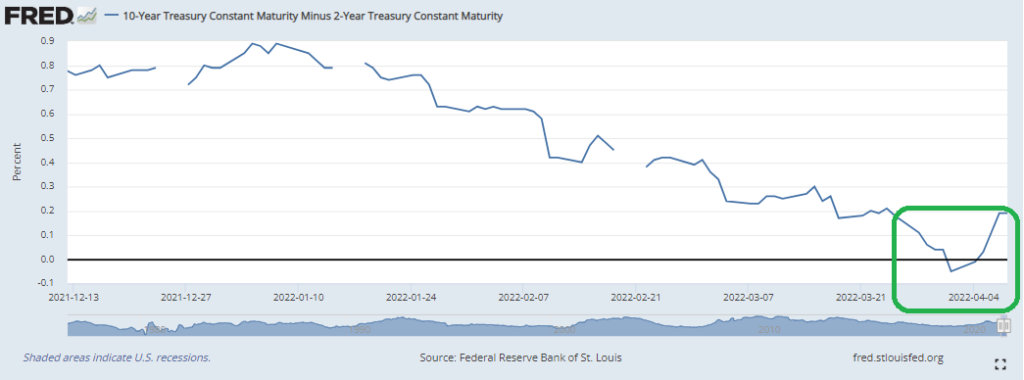
Another argument is that, if history is any guide, the 2-year and 10-year treasury yield curves should be inverted for at least one month for a recession to occur.
The yield curve, however, only inverted for a few days in the current scenario, as shown in the graph below.

Source: FRED
In addition to that, there needs to be more corroborating evidence before investors need to fear a recession is around the corner.
Other signals could include an unanticipated increase in unemployment, a contraction in GDP, or at the very least, a decrease in industrial activity, which is not the case either.
What does all this mean for us as investors
Knowing the historical correlation between inverted yield curves and recessions, one would desire to quickly reduce market exposure, raise some cash, and invest in the safe haven of US Treasury bills.
Nobel Prize winner Eugene Fama and Kenneth French backtested this technique in a research study titled “Inverted Yield Curve and Expected Stock Returns.”
They studied six different yield inversions going back to 1978, shifting portfolios from equities to cash/bills each time the yield curve inverted, and evaluating how the S&P 500 performed after each inversion.
The graph below depicts how the S&P 500 performed 2 years following the 2/10 inversion signal

Source: Financial Times
To the surprise of many, whenever the 2-year and 10-year yield curves inverted, the S&P 500 returned positively 66.67% of the time 2 years after the signal.
In fact, the S&P 500 returned an average of 9% in the twelve months following previous yield curve inversions and 16% over the next two years.
Investors who sold when the 2-year and 10-year yield curves inverted on December 14, 1988, missed the subsequent 34% gain in the S&P 500. Those who sold on May 26, 1998, when it happened again, missed out on another 39% increase in the market.
As the data suggests, whenever the 2-year and 10-year yield curves have been topsy-turvy in the past, it hasn’t paid to abandon equities and move portfolios to cash/bills.
Final Words
- Historically, yield curve Inversions preceded recessions, but there is always the possibility that things may be different this time.
- Even if the 2-year and 10-year Treasury yields inverted, it could be a one-time blip rather than a lasting trend as the 3-month yield to the 2-year yield curves have not flattened which has a 100% historical track record of predicting a recession. That spread has been widening, a signal for better economic growth.
- History and studies also suggest that rather than attempting to boost projected returns by shifting from stock to cash/ safe haven treasury bills after inversions, staying invested in the positively skewed stock markets returned an average of 9% in the twelve months following previous yield curve inversions and 16% over the next two years.
Please note that all the information contained in this article is intended for illustration and educational purposes only. It does not constitute any financial advice/recommendation to buy/sell any investment products or services.


