In the month of August 2021, the S&P 500 showed continued strength by gaining 106.78 points (+1.3%) from 4415.9 to 4522.68.
August 2021 experienced some volatility in the 3rd week, which saw a temporary drawdown (peak to trough) move from 4480.26 to 4367.73 (-2.51%) due to the Covid delta variant spread around the world, and also China tech stocks experiencing further selldown due to additional government crackdowns.
However, that bout of selldown was quickly reversed when markets took the opportunity to once again buy the dip.
In terms of key levels, the S&P 500 managed to achieve 12 separate all-time high instances in August.
Going forward, if there are no major catalysts that will change the ongoing market narrative, we can expect the S&P 500 to trade within the turquoise trend channel below. The S&P 500 will likely be constrained at the 4600 resistance level in the first to second week of August, and 4700 in the third and fourth, with 4450 acting as key support.
In terms of managing downside risks, if the critical 4372 support level fails to hold, this likely means that the stock market will be faced with unexpected market concern(s) that have the potential to trigger further downside below 4236.

TAKEAWAY
- The market posture ending August 2021 remains very constructive.
- Not only did the S&P 500 manage to make 12 all time high instances in the month of August, it was able to close +1.3% for the month.
- The Jackhole Hole Fed speech was a net positive for market participants, where the Fed continued to communicate their accommodative stance going forward.
- In this month’s market outlook, perhaps the best expression to surmise the way forward is “Do not fight the Fed”.
Recap of what we said in our August 21 Outlook
In our August 2021 Market Outlook piece, we recommended our community readers pay close attention to economic growth indicators and also inflation data as key factors to determining whether the US stock market will continue to show strength, or experience a pullback/correction.
Let’s first revisit how several business outlook economic data panned out, before looking at inflation data and employment data.
Results in red are less than ideal for the economy, and green is ideal for the economy.
Business Outlook Economic Data
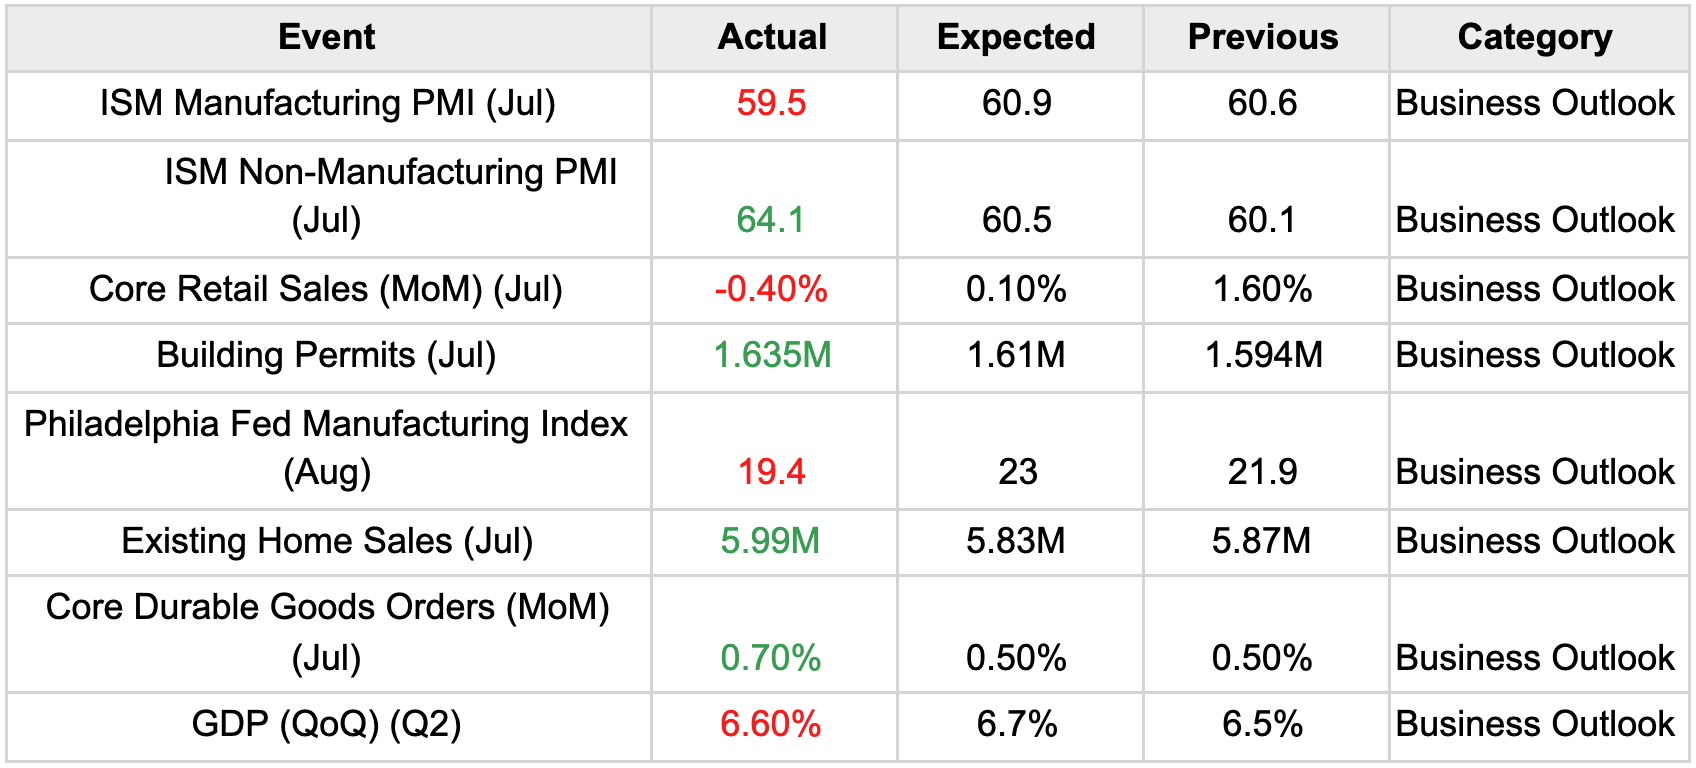
When it comes to the economy’s business outlook, there are several focus areas. First, Purchasing Managers (PMI) are often interviewed in the manufacturing and non manufacturing sectors to determine if businesses are bullish, neutral or bearish in their business sentiment.
Second, consumer spending activities make up the bulk of GDP contribution, and core retail sales directly track consumer spending behaviours.
Third, we also have building permits and home sales data that are tracked to determine the level of construction activities and also home transactions.
Fourth, local states often track the level of manufacturing conducted by companies which provide indication on the robustness of goods produced.
Lastly, core durable goods orders measure the change in the total value of new orders for long lasting manufactured goods.
In summary, the economic outlook indicators are showing mixed results.
Most notably, while GDP has slightly softened compared to expectations, backed by lower consumer spending (accounts for 70% of GDP) as seen by a significant drop in core Retail sales, there are other areas of the economy that have held up and continue to beat expectations.
A balanced view is that economic data doesn’t appear to be 100% robust. However, it also cannot be concluded that stagflation will occur whereby economic growth has conclusively shown to have dropped.
Inflation Data

The Consumer Price Index (CPI) measures the change in the price of goods and services from the perspective of the consumer. It is a key way to measure changes in purchasing trends and inflation.
A persistently high CPI reading can be taken as being bearish for the equities market. A sustainable 2% (YoY) and below CPI reading is bullish for the equities market as that represents the Fed’s long term inflation target range.
Inflation dropped lower than expected in July as the price index decreased to 0.3%, below the expected forecast of 0.4%, and also above the previous month’s 0.9% increase.
Prices for shelter, food, energy, and new vehicles all increased in July. The index for used cars also increased but was much smaller than the surge in prior months.
However, the data does not conclusively show that inflation is abating. The Producer Price Index (PPI), which measures the change in the goods price sold by Producers, and is a leading indicator of consumer price inflation. The PPI has increased more than is expected by most economists although it has not exceeded the prior month’s value. This may suggest persistent inflation remains within the realm of reasonable possibilities.
The US CPI increase slowed in July, breathing sighs of relief as signs of inflation peaking may be present. However the PPI appears to suggest otherwise.
Should inflation results continue to increase in the subsequent months, this would increase concerns over persistent inflation occurring which may inadvertently result in the Fed raising interest rates early.
Employment Data
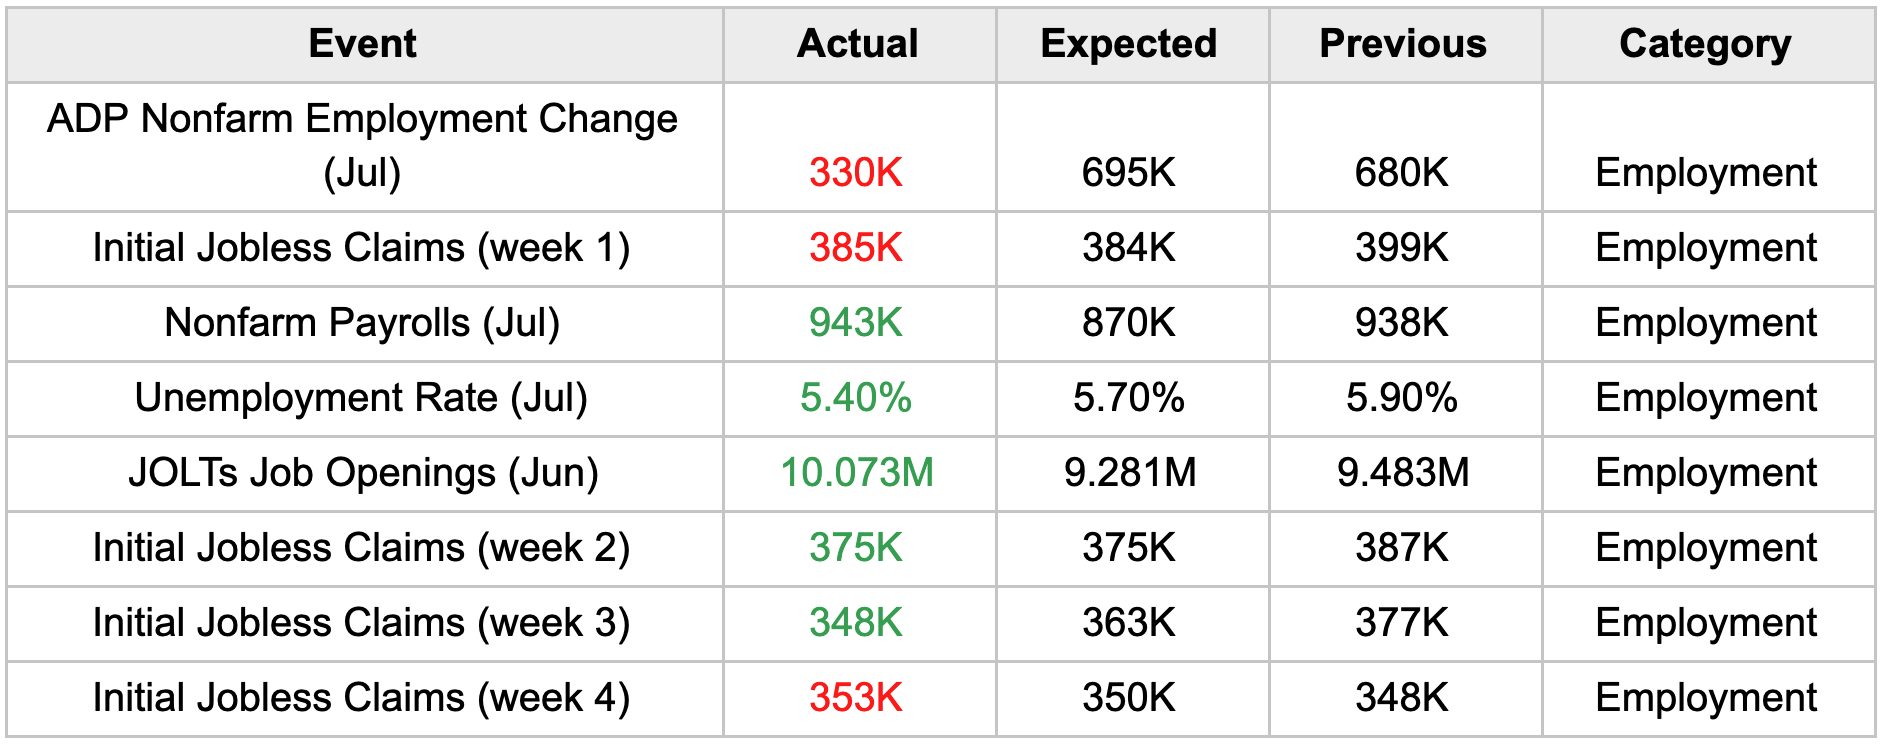
Since 1977, the Federal Reserve has operated under a mandate from Congress to “promote effectively the goals of maximum employment, stable prices, and moderate long term interest rates” — what is now commonly referred to as the Fed’s “dual mandate.”1
This clearly shows how important employment data is to the Fed’s monetary and interest rate decision making process.
When it comes to the employment data, there are several focus areas. First, the Fed has the ability to track payroll changes on a monthly basis in non farming industries (ADP Nonfarm Employment and Nonfarm payrolls).
Second, on a weekly basis, it also tracks the number of people that are filing for jobless claims.
Third, it is also able to track the number of job openings generated by businesses at large.
Last and most important, it is able to measure on a monthly basis the level of unemployment in the US.
Positives
The general trend of the weekly jobless claims (385K to 353K) appear to be heading in the correct direction, dropping favourably week on week. The final week of August appears to show an increase in jobless claims (348k to 353K), although more data is needed to confirm if peak employment has indeed occurred.
JOLT Jobs’ opening data, while a laggard (we only have data going back to June), continues to surprise to the upside with businesses generating 10M new jobs compared to 9.3M jobs expected.
Negatives
Before the Covid-19 selldown in 2020, the US economy was maintaining a very low unemployment figure at 3.5%.
Unemployment rate rocketed to a record +14.7% not seen in the past 30 years in May 2020, a year ago. The record high was due to the Covid-19 pandemic.
The current unemployment rate of 5.4% is on a decreasing trend however it is clearly not back at pre-Covid levels indicating the economy is still not ideal.
The Balanced View
The current unemployment rate of 5.4% is on a decreasing trend however it is clearly not back at pre-Covid levels indicating the economy is still not ideal.
A less than ideal unemployment rate provides reason for the Fed to keep monetary policy loose which is bullish for stocks, however what is unclear is at which point of the decreasing unemployment trend will the Fed take the cue to start the tapering process.
Market Outlook
The Jackhole Hole Fed speech that occurred near the end of August 2021, was a keenly watched event, as all Fed voting and non voting members met, discussed and voted on tapering the Fed’s asset purchasing program and also interest rate hikes.
The much awaited announcement, in summary, was that the Fed will likely begin to cut the amount of asset bonds it buys (when it buys bonds it introduces monies into the economy) before the end of year.
This announcement actually sent the stock market soaring to a new all time high.
Wait, the Fed says they are intending to start tapering soon (less accommodative) yet that is well received by investors?
That is because the Fed Chairman Jerome Powell, had this to say2:
“The timing and pace of the coming reduction in asset purchases will not be intended to carry a direct signal regarding the timing of interest rate liftoff, for which we have articulated a different and substantially more stringent test,” Powell said in prepared remarks for the virtual summit.
He added that while inflation is solidly around the Fed’s 2% target rate, “we have much ground to cover to reach maximum employment,” which is the second prong of the central bank’s dual mandate and necessary before rate hikes happen.
Clearly the Fed appears to be sticking to its mandate, by focusing on maximising employment without causing undue inflation.
The key to navigating the equities market in the coming month and beyond is to focus on the progress of the employment rate, and how soon it can get to the pre Covid level of 3.5%, without causing persistently high inflation.
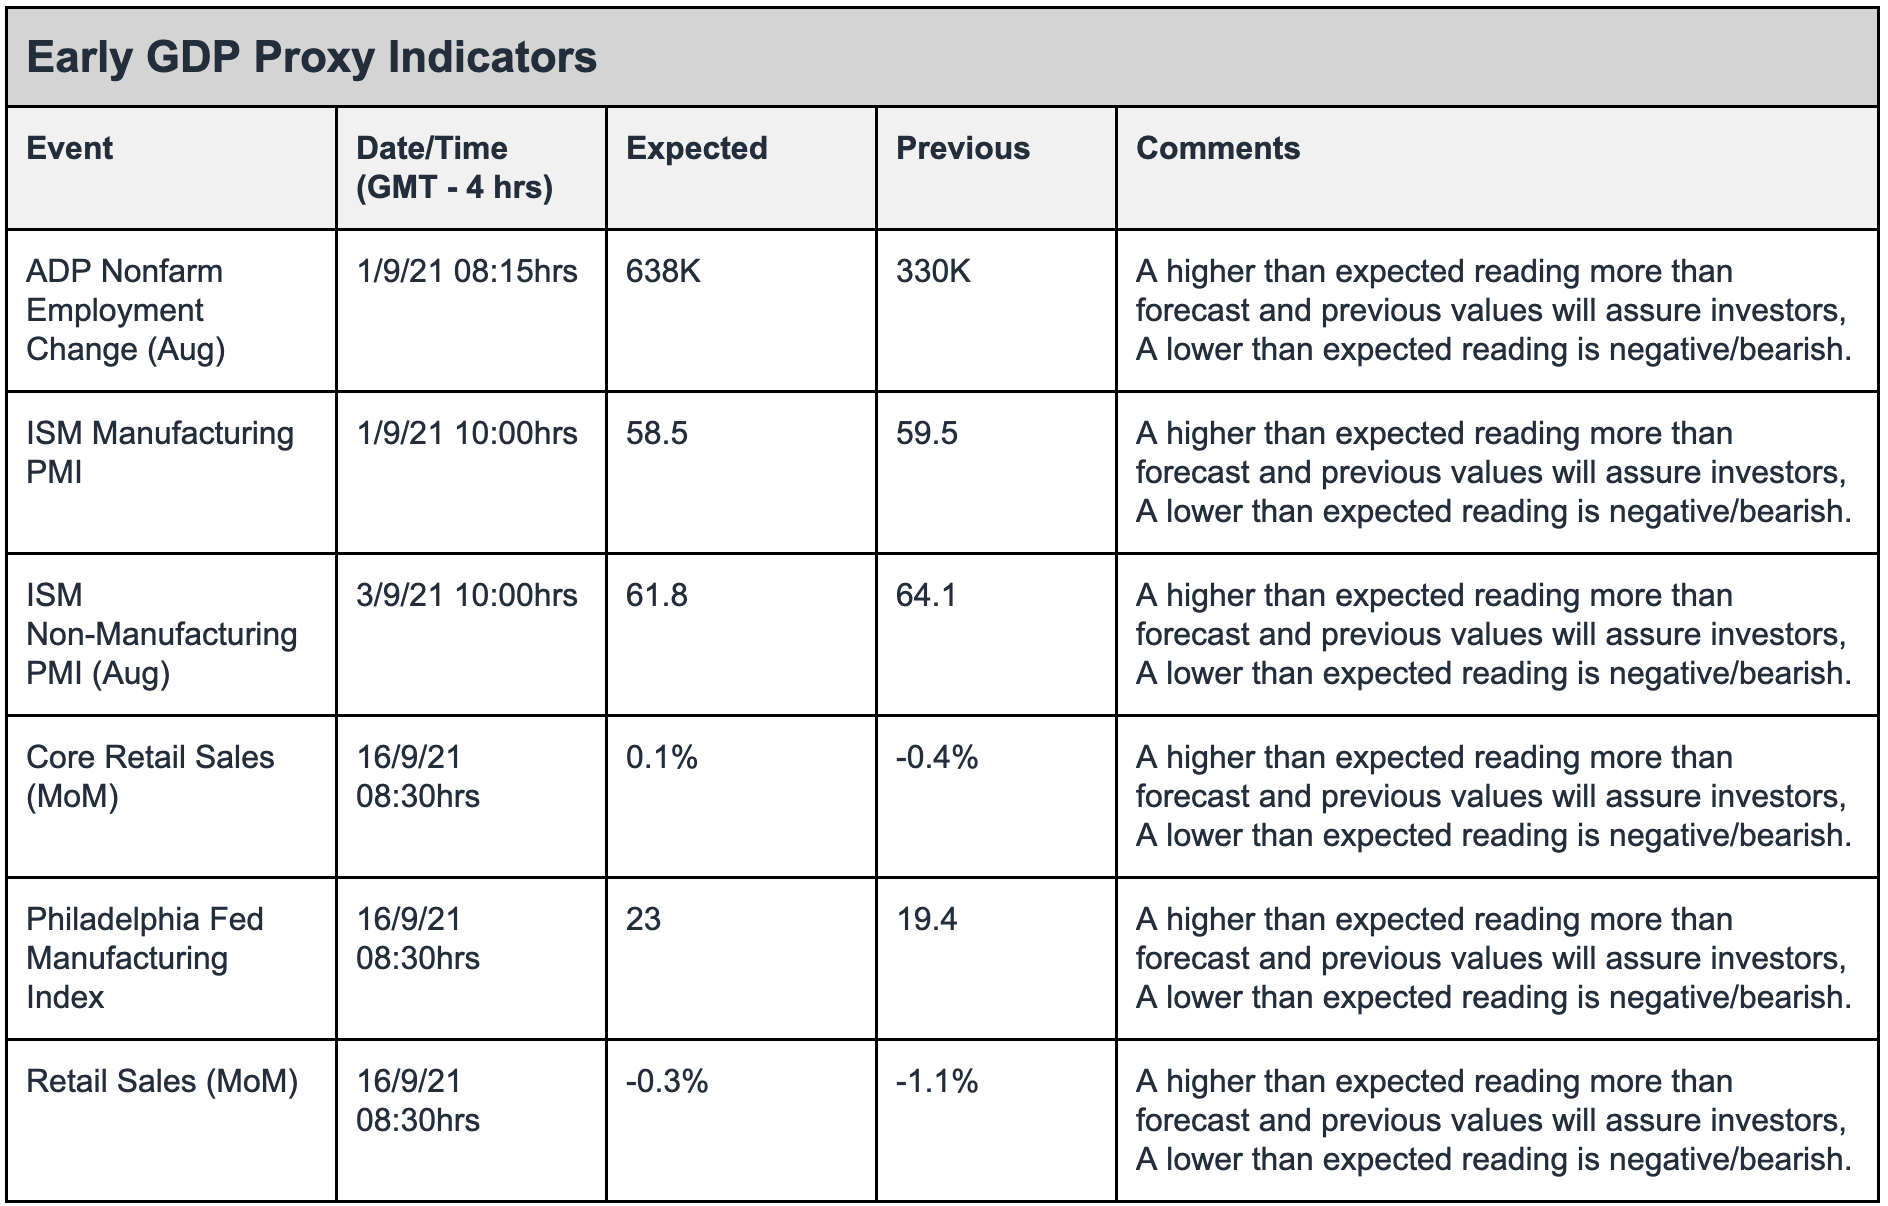
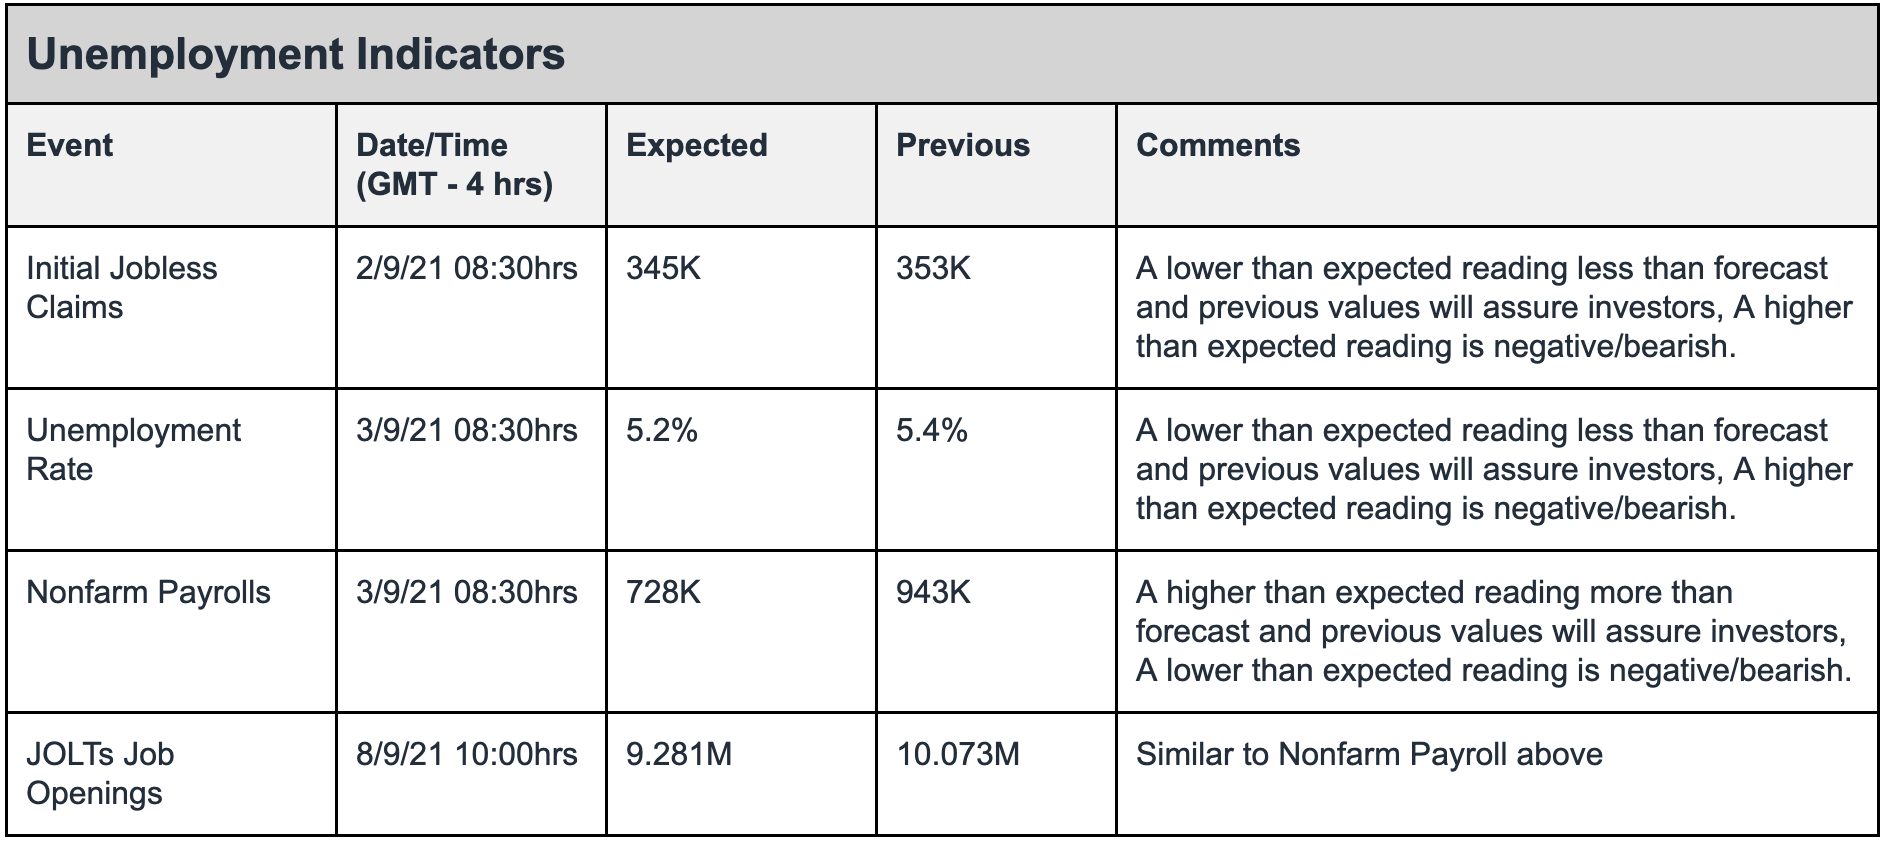
AlgoMerchant community readers can refer to the summary table with details on unemployment, GDP and inflation proxies and their reporting dates to make informed trading decisions based on these economically sensitive data.

What does history tell us about where the US Stock Market might be heading?
As of end August 2021, the S&P 500 is already up more than 15% year to date.
Did you know, historically speaking, that whenever the S&P 500 is up more than 15% by August, big corrections/pullbacks for the remaining months of the year are rare?
This is according to research done by Ryan Detrick of LPL Research3, who observed from data dating back to the 1950s, there had only been 15 times the S&P 500 was up more than 15% by August (including 2021). Here is a summary of what has likely happened going forward for the rest of the years:
- In 13 out of all 15 instances (87%), the S&P 500 continued higher for the remaining months of the year.
- 1987 was a clear outlier, which was up 36.2% by August then experienced a sharp correction. The remaining instances had more reasonable growth (<27%) by August.
- On average, the S&P 500 was 7.33% higher in December compared to the August months.

Our Community readers might also be interested to know the maximum drawdowns experienced in the remaining 4 months, in these 14 prior instances.
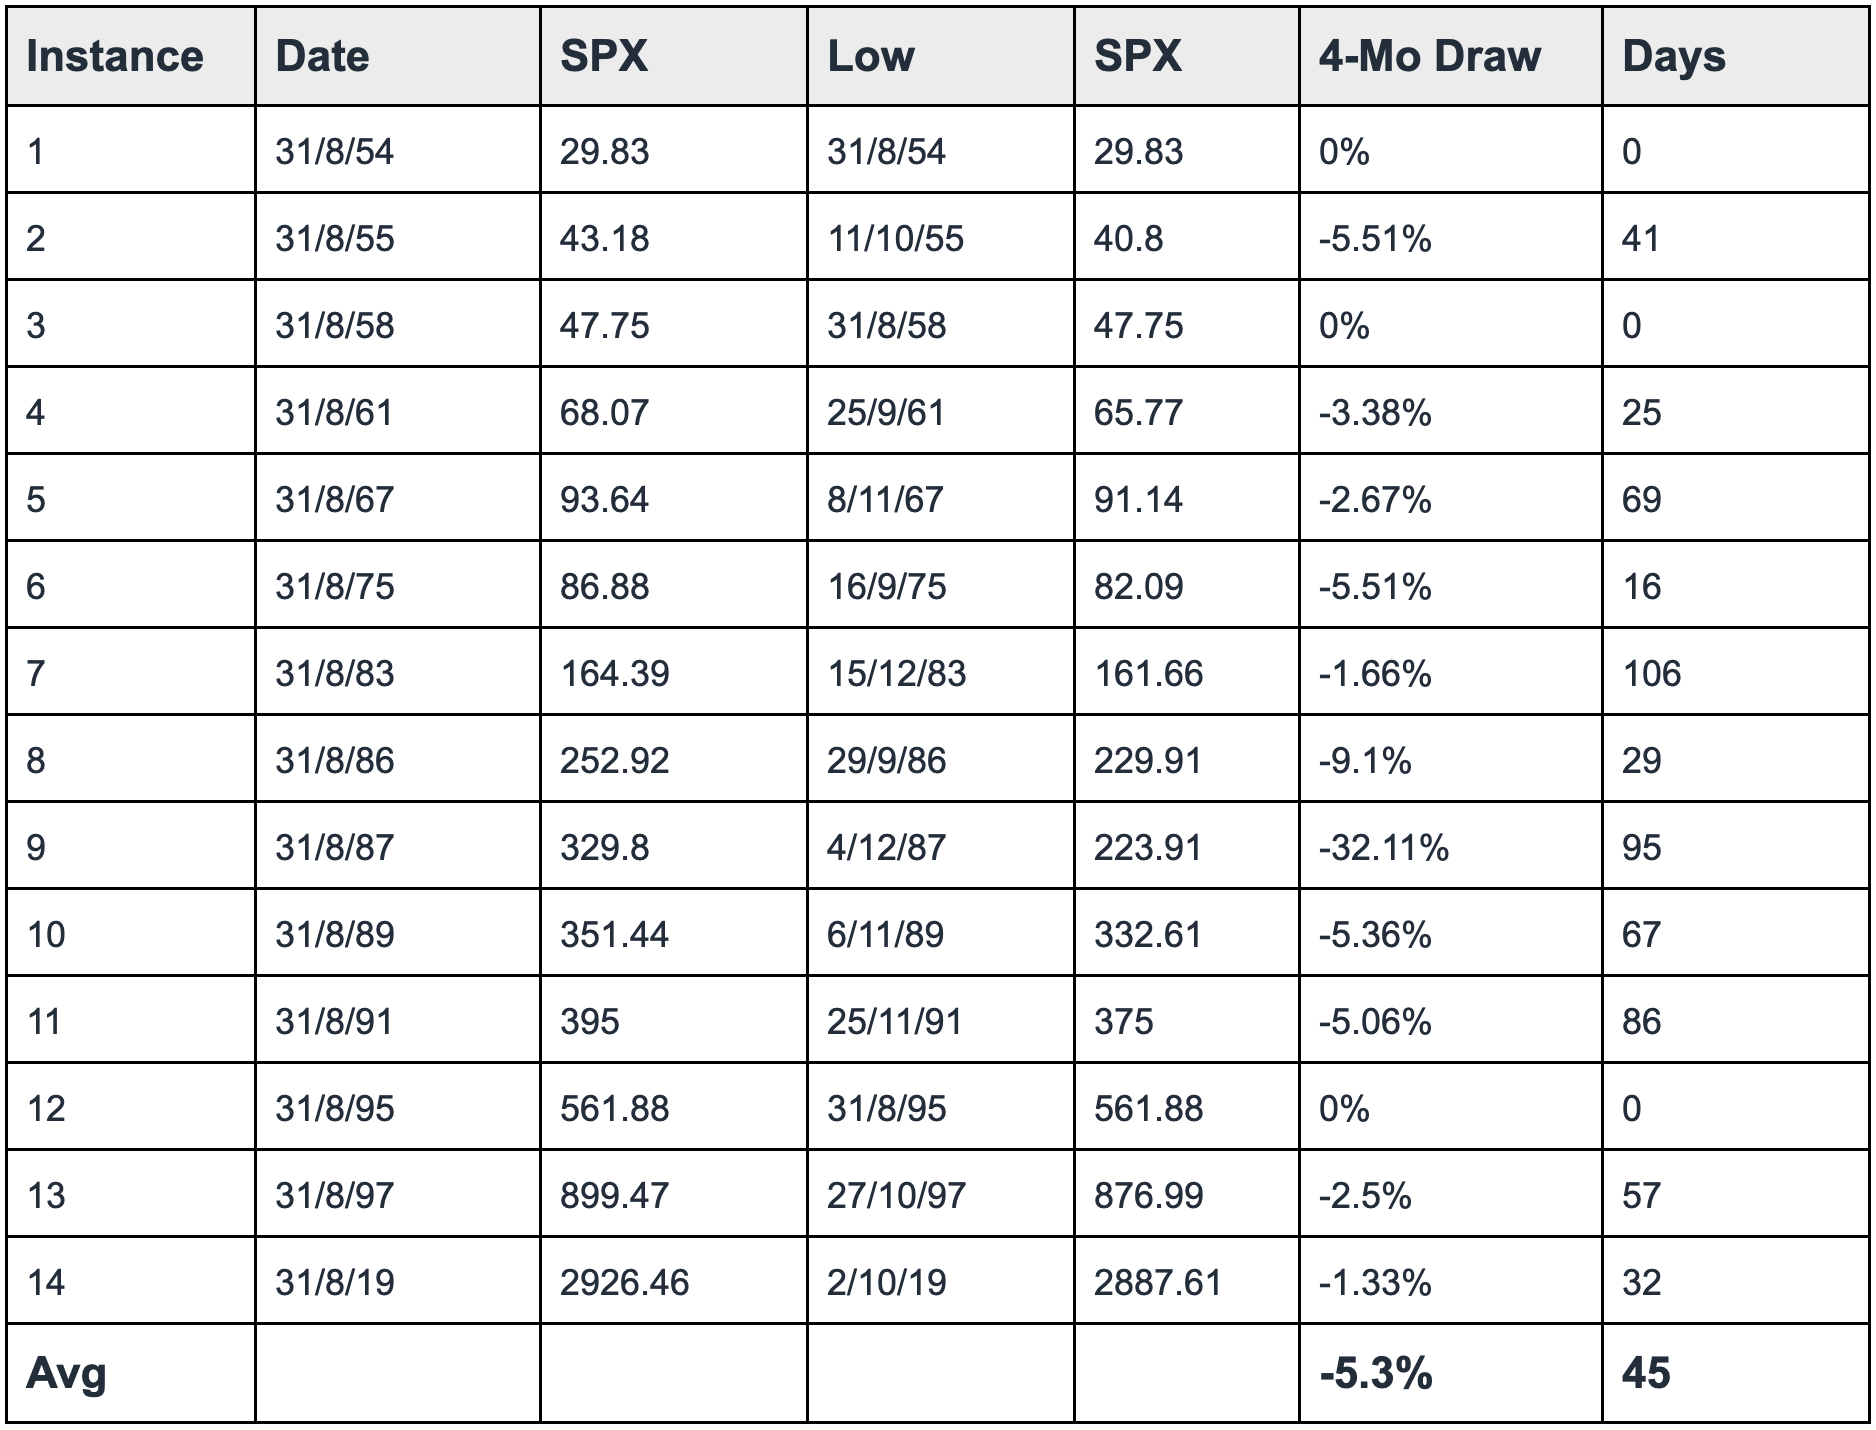
Overall, it may be reasonable to say that in order to experience an expected return of 7.33% that has an 87% probability, one has to endure an expected -5.3% drawdown risk.
This, of course, assumes history will continue to play out which is no guarantee.
Conclusion
In this month’s market outlook, perhaps the best expression to surmise the way forward is “Do not fight the Fed”.
Traders and investors keen to profit for the equities market should continue to watch how price action behaves relative to economic news and data that will disseminate through the news media from time to time.
It will be ill advised to impose one’s own opinion on how the Fed will react, and where the stock market should head. For example, just because the stock market has been extremely bullish, and tapering is going to happen soon, means that the stock market should correct/pullback. This unfortunately may, or may not materialise.
The best way to explain the current market sentiment is that investors and traders are fully aware that as long as unemployment goals are not met with inflation not shooting through the roof, these investors and traders are taking advantage of the fact that the Fed will stick to their mandate and be accommodative.
Furthermore, even if the Fed starts to taper, as long as they do it in a market friendly manner, consistent with economic improvements, it may not result in a dramatic deterioration of market sentiment.
It is increasingly clear that investors are taking advantage of a clear sweet spot right now, whereby employment targets are not met in the face of seemingly ‘transitory’ inflation, suggesting there is a sense of certainty towards what the Fed is going to do – which is to remain easy.
This of course, is until they prove otherwise.
Disclaimer: Please note that all the information contained in this newsletter is intended for illustration and educational purposes only. It does not constitute any financial advice/recommendation to buy/sell any investment products or services.
1https://www.richmondfed.org/publications/research/economic_brief/2011/eb_11-12#:~:text=Since%201977%2C%20the%20Federal%20Reserve,goals%20can%20be%20traced%20back
2https://www.cnbc.com/2021/08/27/powell-sees-taper-by-the-end-of-the-year-but-says-theres-much-ground-to-cover-before-rate-hikes.html?__source=androidappshare
3https://twitter.com/RyanDetrick/status/1430646660225454083?ref_src=twsrc%5Etfw


