The general theme of our September 2020 edition market outlook has slightly changed since the last two quarters. While concerning market data are still present, towards the end of August 2020, a slightly more favourable market outlook has evolved. Although it must be highlighted this favourable outlook is occurring on the back of a US stock market that is already showing signs of over extension since the March 2020 run up.
TAKEAWAY
The slightly favourable market outlook can primarily be attributed to the Fed’s announcement on 27th August 2020, where they signalled a major policy shift in the way they plan to tackle the issue of persistently low inflation rates since 2012. This resulted in a further bullish run up for the US stock market that is already showing signs of over extension.
The Fed signalled it will continue to maintain low interest rates, as well as a more flexible approach towards targeting their inflation strategy. Their new framework is favourable for Equities from a macro economical perspective as the combination of a low interest rate environment and loose monetary policy is expected to flood financial markets with excess liquidity.
However, concerning data still remains, in the form of a stubborn Vix, declining US consumer spending confidence, increasing US debt to GDP ratio, and lastly complacency as shown is Call versus Put options data.
This signals a cautionary approach to market risks is still warranted, as the US stock market is showing signs of being over extended.
Bird Eye View
In fact, since the start of August 2020 towards the 3rd week, the US stock market had begun to look lacklustre after a 5 month bullish run up since late March 2020 when equities bottomed out. The market was looking less optimistic in early August 2020 than it was in June 2020, when the USA and other major economies around the world started to come out of ‘Lockdown’ mode. Between June to August 2020, financial markets had to deal with concerns over the resurgence (2nd wave) of the Covid-19 virus.
This showed up in terms of market breadth, and several other market data. Market breadth was looking very lopsided, whereby only a handful of popular stocks were leading US indices higher, while stocks in the broader market were declining.
However, since the Fed announcement, US indices continued their run up, with the S&P 500 even breaking its “All Time High” at 3392 in February 2020 just before the Covid-19 pandemic selldown.
Let’s review the latest market data that will help shape the market outlook going forward.
Financial Stress Index
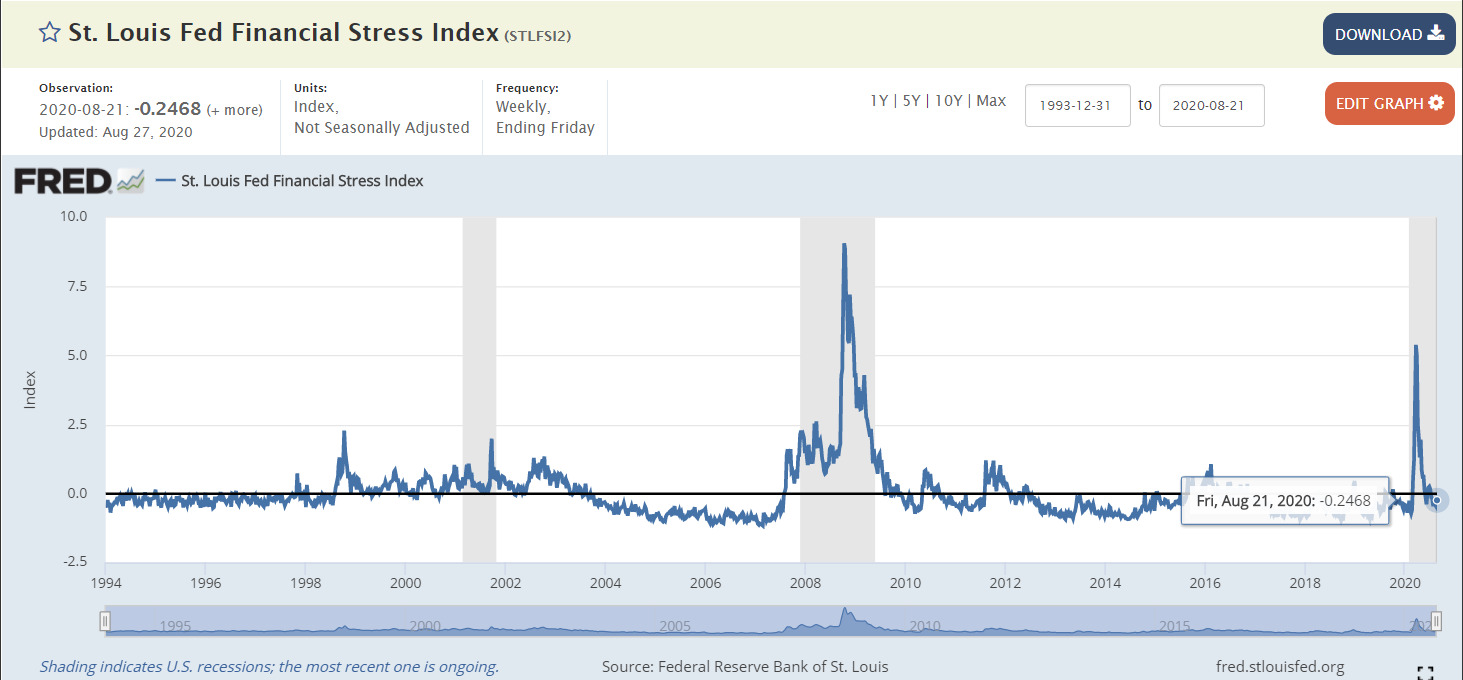
The Financial Stress Index measures the degree of financial stress in the markets and is constructed from 18 weekly data series, all of which are weekly averages of daily data series: seven interest rates, six yield spreads, and five other indicators.
The St. Louis Financial Stress Index peaked at 5.83 on 20th March 2020, at the peak of the Covid-19 pandemic selldown. Previously the record was 9.06 during the 2008 financial crisis.
The average value of the index, which begins in late 1993, is designed to be zero. Thus, zero is viewed as representing normal financial market conditions. Values below zero suggest below-average financial market stress, while values above zero suggest above-average financial market stress.
The -0.2468 financial stress index value indicates the stress level in financial markets have declined back into normal conditions.

Dollar Index
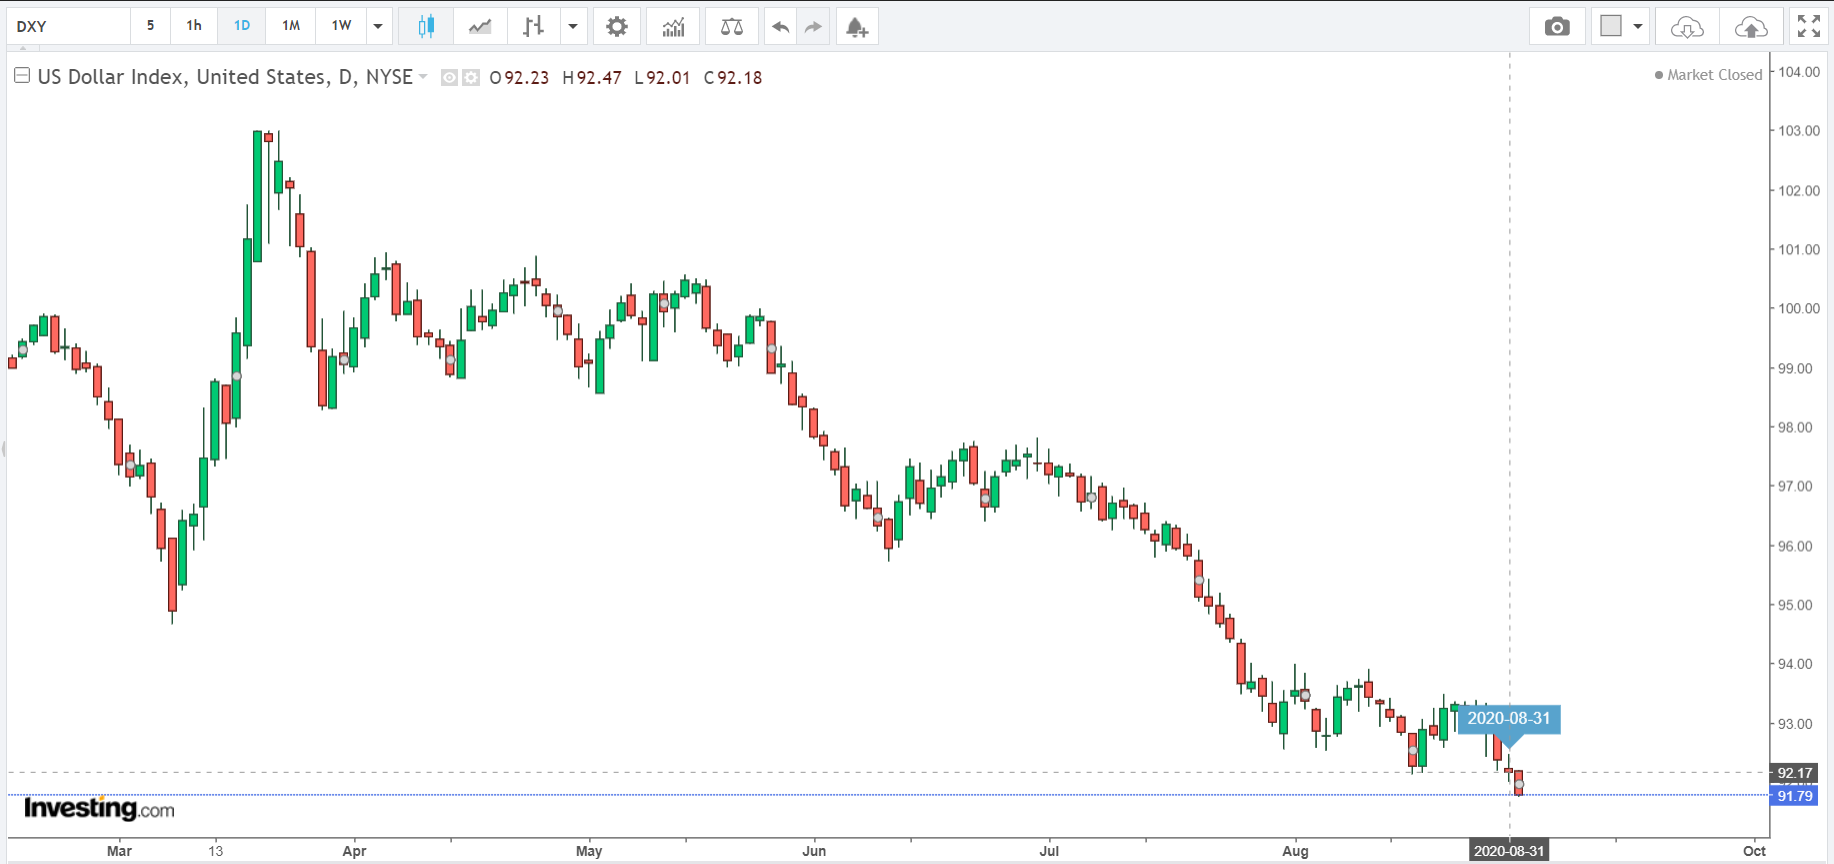
The U.S. Dollar Index is an index of the value of the United States dollar relative to a basket of foreign currencies, often referred to as a basket of U.S. trade partners’ currencies.
The dollar index hit a year to date high at 103 in March 2020, before falling to 92.18 end August 2020.
This drop in the dollar index came about when the Fed announced significant changes to its written policy strategy that are widely seen as leading to an easier monetary policy stance over time.
There are many factors that will result in a drop in the Dollar Index. Some of these factors while bearish for the Dollar Index may be bullish for the stock market and vice versa.
In this case, an easier monetary policy is expected to be bullish for the stock market since more supply of the US dollar will result in increased market liquidity.

Gold Prices
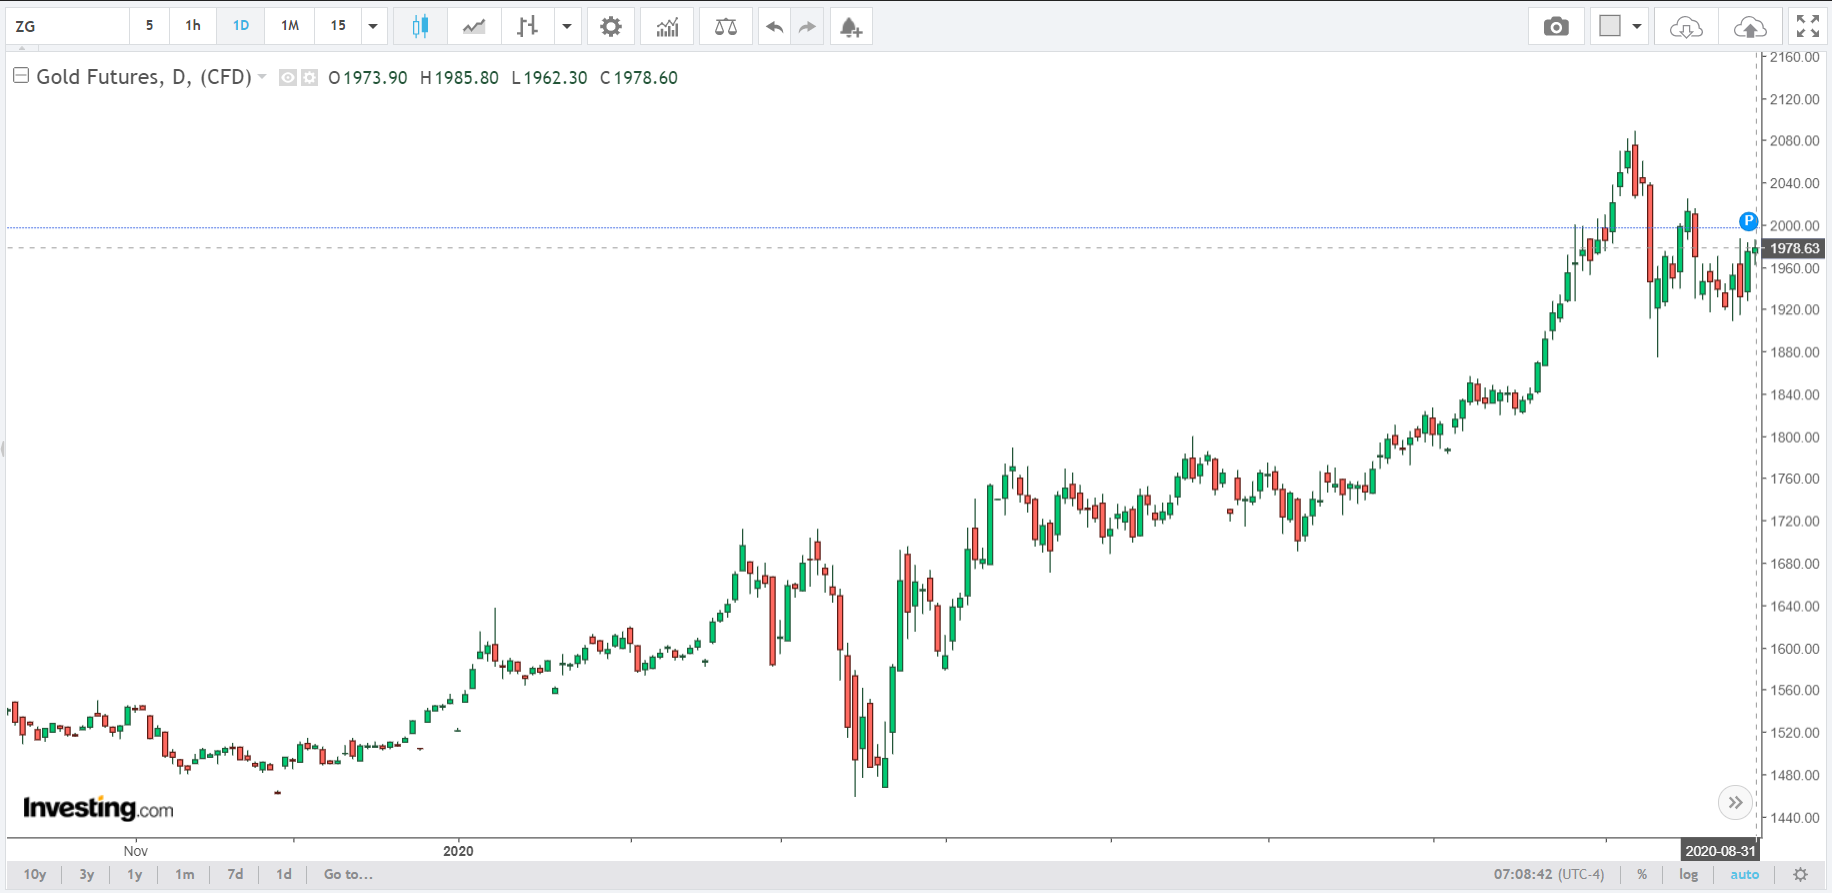
Gold hit an all time high at 2089 in the month of August 2020, before pulling back to close at 1978 on 31st August 2020.
Since the pullback from the 2089 all time high, gold prices have been consolidating despite a rising stock market.
This could indicate decreasing market uncertainty.
When money is shifting to gold and gold prices rise steadily, it often indicates that investors are looking for a safe haven due to the uncertainty in the market.

Initial Jobless Claim
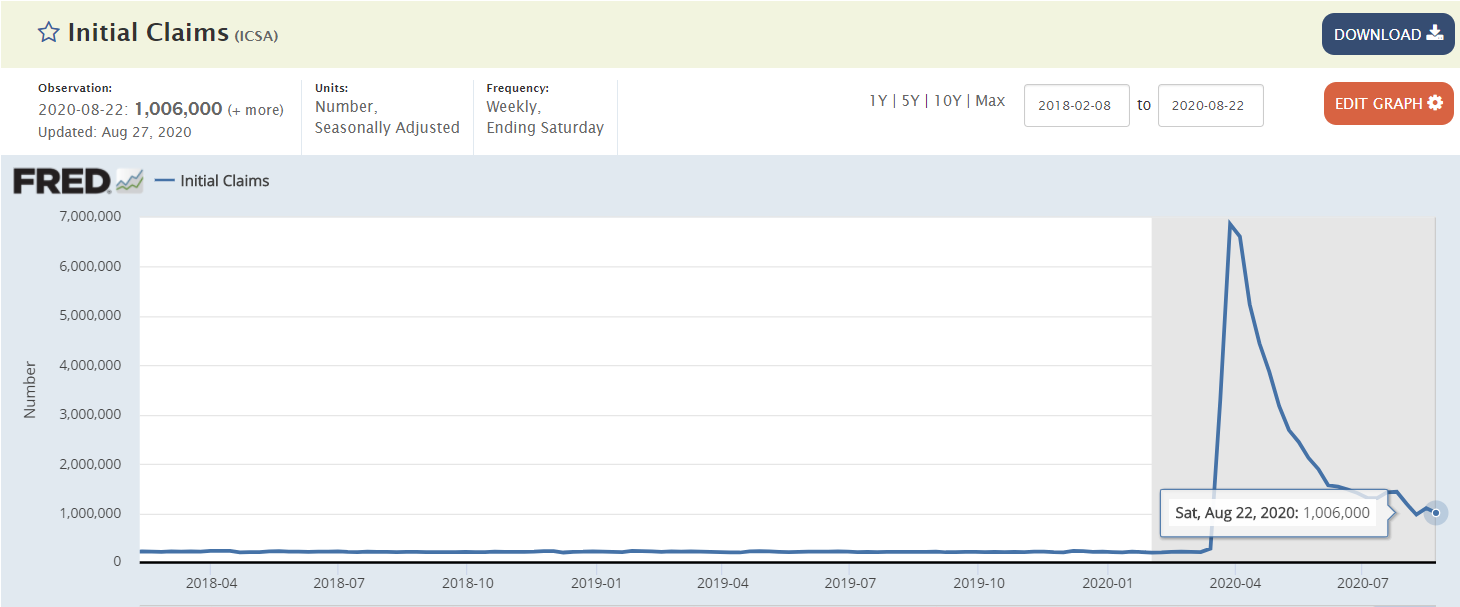
Initial Jobless Claims measures the number of individuals who filed for unemployment insurance for the first time during the past week.
This is the earliest U.S. economic data and is a leading indicator. Increasing initial jobless claims should be viewed as bearish for the financial markets.
New applications for jobless benefits fell in late August to just above 1 million and resumed a downward trend, perhaps signaling the resumption of a gradual if painfully slow recovery in the U.S. labor market.

Volatility Index (VIX)
VIX is the implied volatility of the S&P 500 for the next 30 days. It typically ranges below 20 during bull markets and has not exceeded 50 since the 2008 financial crisis.
The CBOE VIX remains stubbornly above 20 as VIX increased from 24.59 to close at 26.41 as of 31st August 2020.
This is despite the S&P 500 hitting new highs and is clearly on a bullish trend.
A stubborn Vix that refuses to break below the 20 threshold with a bullish S&P 500 making new highs is something to be concerned about.

US Consumer Spending
The consumer confidence index is closely watched as an indicator of economic health because consumer spending accounts for about 70% of economic activity.
An increasing US Consumer Spending trend is bullish for the economy, whereas a decreasing trend is generally bearish/concerning.
Consumer Confidence unexpectedly fell beginning of August to its lowest level in half a decade as consumers are increasingly worried about the economy following a sustained surge in covid-19 cases this summer.
The Conference Board reported that its consumer confidence index, which measures how optimistic consumers feel about the economic outlook, dropped to a reading of 84.8 this month, down from 91.7 in July.

US Federal Debt: Total Public Debt to GDP Ratio
The federal debt is the total monies the US federal government owes to its creditors and debt investors.
Historically, the US federal debt as a percentage of gross domestic product (GDP) will increase during wars and financial crises, and decline subsequently when things normalise. The ratio of debt to GDP may decrease as a result of a government surplus or due to growth of GDP and inflation. For example, debt held by the public as a share of GDP peaked just after World War II (113% of GDP in 1945), but then fell over the following 35 years.
According to the Congressional Budget Office, US debt-to-GDP ratio has already reached its highest level since World War II, at 98 percent in 2020, media reports said. This is concerning, considering the US economy remains vulnerable and requires further federal government support that may worsen its debt burden.
In recent decades, aging demographics, rising healthcare costs, and the perceived need to maintain adequate liquidity for financial markets have led to concern about the long-term sustainability of the federal government’s fiscal policies.

Open Call – Put Options Data
When markets are bullish, Call options tend to rise in value while the reverse is said for Put options. This is the design of options whose primary purpose is to function as hedges depending on which direction traders have their stock exposures.
Since the March 20 lows, markets have been bullish and option speculators are increasingly purchasing Call Options relative to Put Options to capitalise on option value appreciation. The lack of popularity of Put Options is also telling of a general level of complacency in the markets as less traders and investors have hedges in place for a market selldown.
In fact the delta between Open Call – Put options are so wide (>10%) and trading at levels not seen since 2000, that may suggest markets are over complacent and risks of a market selldown are increasing.

Conclusion
- The Fed’s announcement on 27th August 2020, where they signalled a major policy shift in the way they plan to tackle the issue of persistently low inflation rates since 2012, resulted in a further bullish run up for the US stock market that is already showing signs of over extension.
- The Fed signalled it will continue to maintain low interest rates, as well as a more flexible approach towards targeting their inflation strategy.
- Their new framework is favourable from a macro-economic perspective for Equities as the combination of a low interest rate environment and loose monetary policy is expected to flood financial markets with excess liquidity.
- However, concerning data still remains, in the form of a stubborn Vix, declining US consumer spending confidence, increasing US debt to GDP ratio, and lastly complacency as shown is Call versus Put options data.
- This signals a cautionary approach to market risks is still warranted, as the US stock market is showing signs of being over extended.


