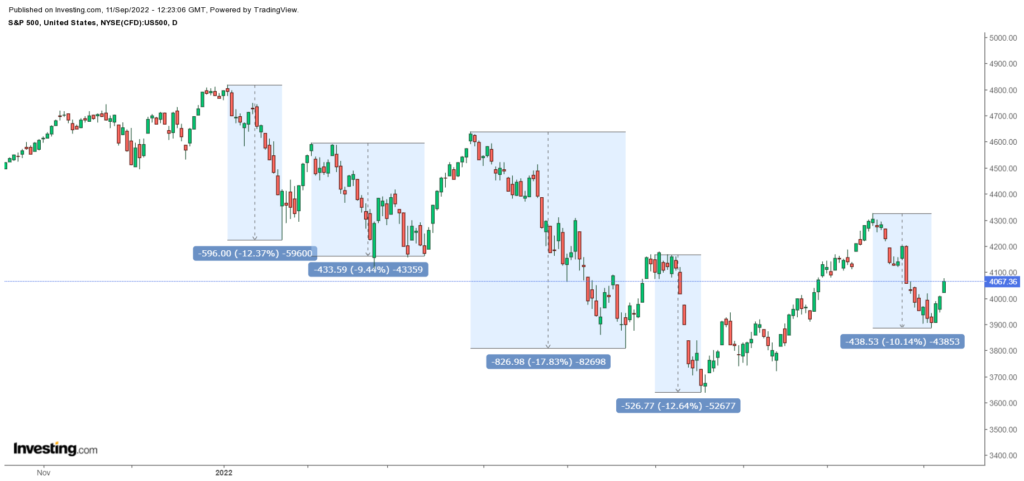
Did you know that there have been a total of five instances of market selloffs, corrections, and pullbacks since the beginning of 2022? 🤔
These 5 instances have peak-to-trough maximum drawdowns ranging from -9.4% to -18%. 📉
Here’s a question for all our readers – how many of you would love to own an intelligent strategy that is able to tell you when the market bottoms during periods of heavy selldown and correction?
Will you be surprised if we told you that our flagship Tri-X AI trading robot had successfully identified and made rewarding trading positions in ALL the market selldown instances since the beginning of 2022? 😯
Our cutting-edge Artificial Intelligence (A.I.) solution has successfully executed real trades right at the point where the market bottomed out. 📉📈
In this article, we will demonstrate how Tri-X has accurately identified every single market bottom in the U.S. stock market since the beginning of 2022 and how she generates ‘ALPHA’ returns by buying stocks even when the market is bearish, volatile, or in a state of crisis!
Instance #1: Russia-Ukraine War Correction
Early in 2022, as tensions between Russia and Ukraine were rising, investors fled the market, and the S&P 500 experienced a panic sell-off from its record highs.
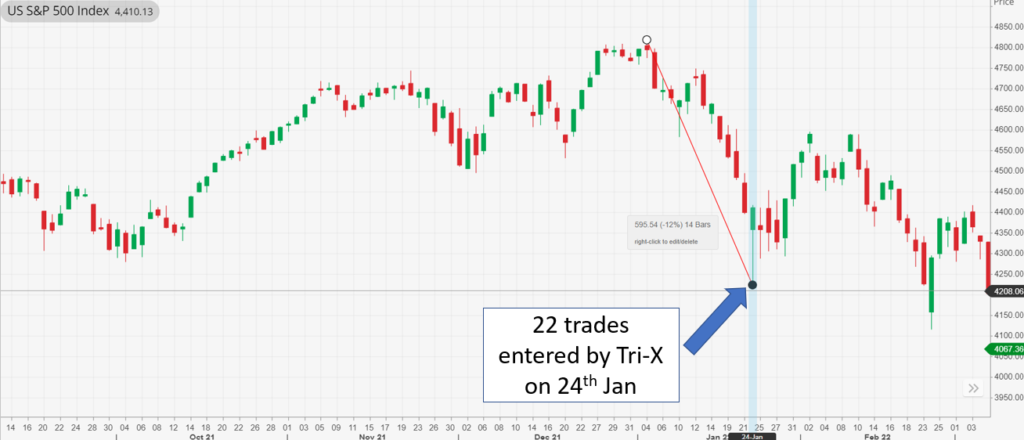
The outcome was a quick market correction surmounting to a peak to trough -12% drawdown in a matter of days.
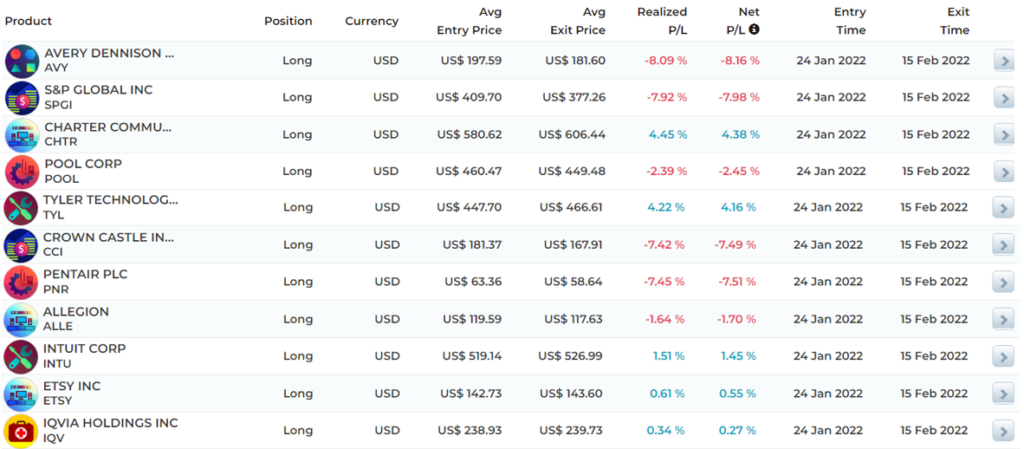
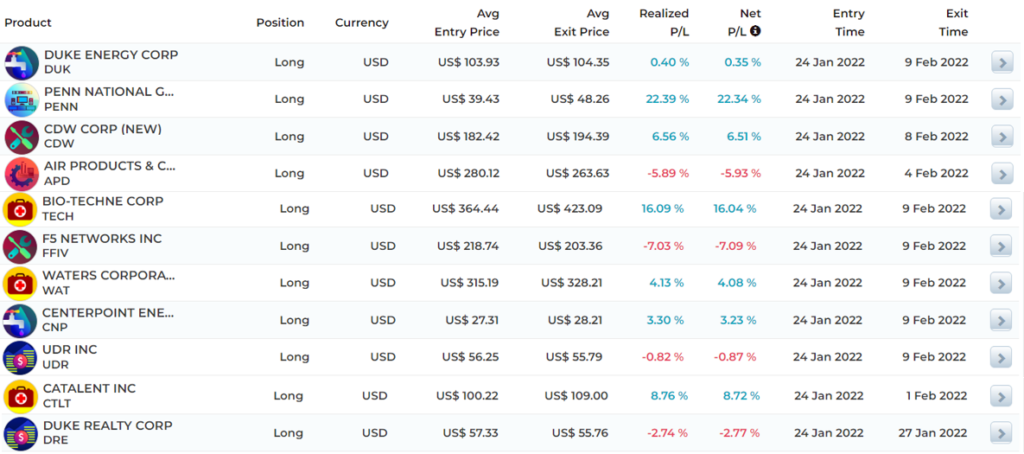
Tri-X made her move on the day of the correction low on 24th Jan 2022 and entered into a total of 22 trades with a net P/L ranging from -8.16 to 22.34%!
Instance #2: Inflation Induced Pullback
While the stock market was already facing headwinds from Russia-Ukraine geopolitical tensions, the Federal Reserve increased market volatility by signaling tighter monetary policy in response to never before seen 4-decade high inflation.
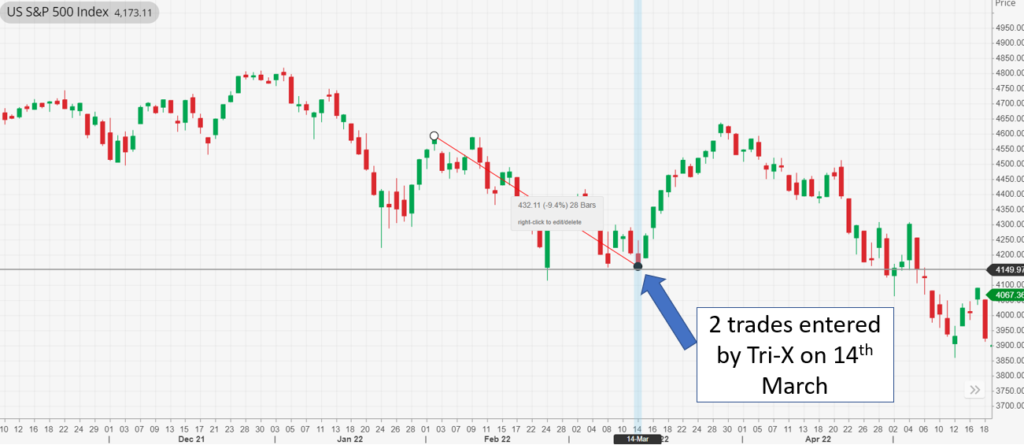
That resulted in a near-term peak to trough drawdown of -9.4% between February to March 2022.
Tri-X entered into 2 trades in total with 100% win rates and a net P/L of 28.5%!
Instance #3: Severe selloff amid macro-economic concerns
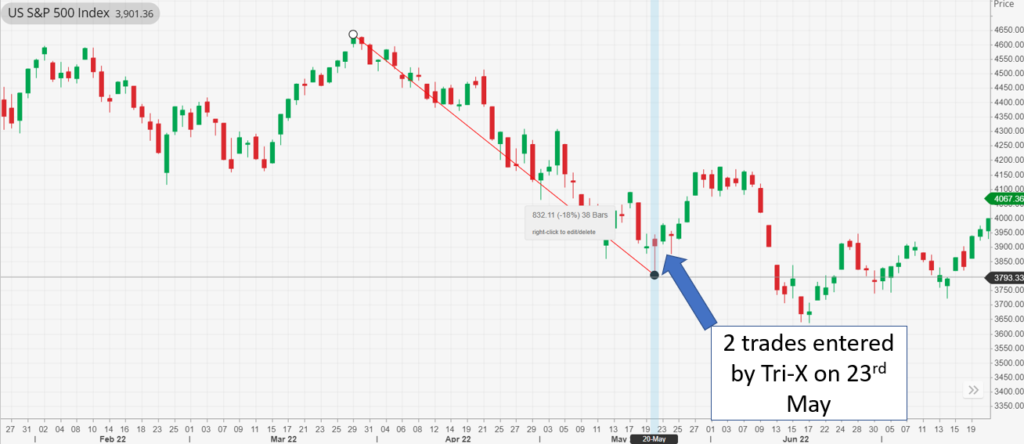
The S&P 500 briefly entered bear market territory on May 20th 2022, for the first time since March 2020, as investors continue to evaluate record inflation, surging interest rates, and its impact on corporate profits.
The near-term peak-to-trough decline was -18% between March and May 2022.
While Tri-X didn’t make her move on the bear market low of May 20th, Tri-X made her move on the next trading day, May 23rd 2022, and successfully executed 2 trades with a net P/L of 5.26%!

Instance #4: Recession Fears Selldown
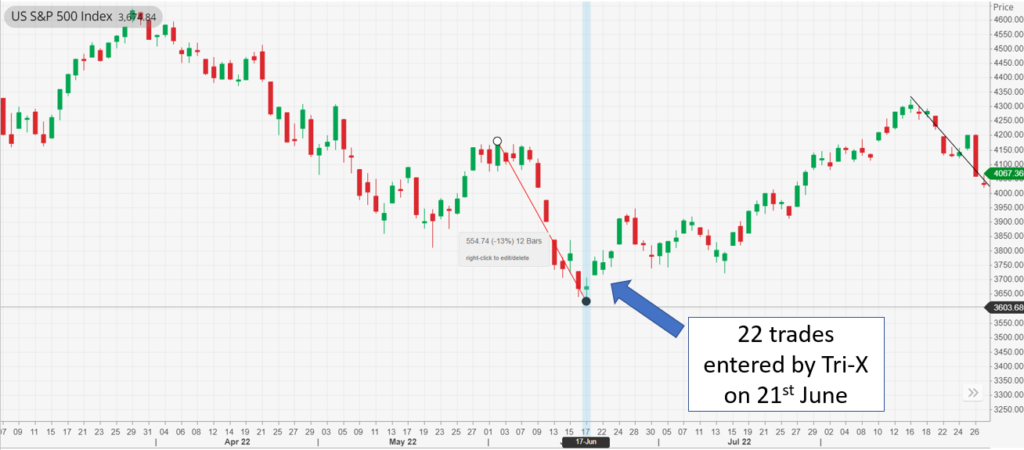
The Federal Reserve’s highest rate hike in almost 30 years to combat decades-high inflation stoked recession fears, and the S&P 500 lost 13% from near-term peak to trough.
Tri-X made her move on the following day of the correction low, i.e. on 21st June 2022, and entered into a total of 22 trades!
These 22 trades by Tri-X had a net P/L ranging from -8.65 to 12.45%!


Instance #5: Volatile August 2022
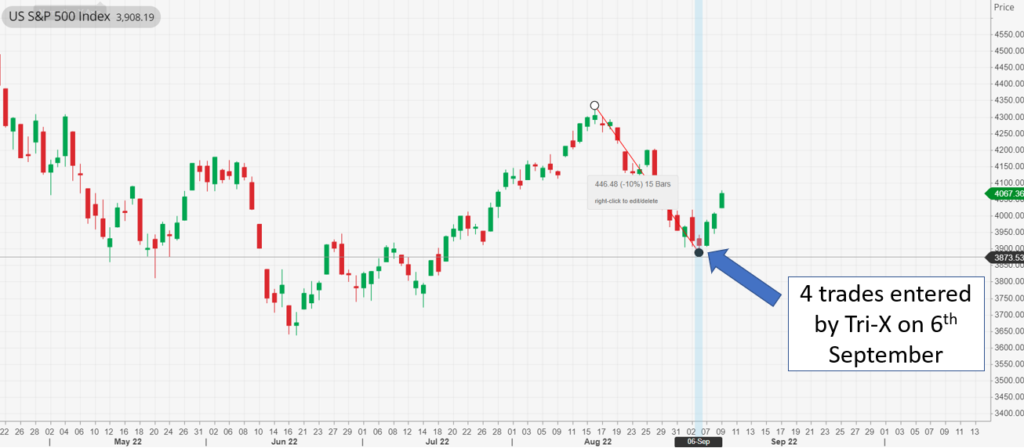
Following the Fed’s stance on additional interest rate hikes, the selloff intensified in the second half of August 2022, and the S&P 500 dropped 10.14% from near-term peak to trough.
Tri-X made her move on the day of the correction low on Sept 6th 2022, and entered into a total of 4 trades!
As of September 9th, 2022, all four trades entered by Tri-X are profitable, with an unrealized gain of 21.48%!

FINAL WORDS
Since humans created the stock market, the human initiatives to identify market bottoms accurately and consistently have resulted in a never ending pursuit with little yield. At AlgoMerchant we believe we have created not a human solution, but an Artificial Intelligence (AI) solution that has a good track record in identifying market bottoms.
In this article we have demonstrated how AlgoMerchant’s flagship AI trading robot Tri-X, has consistently identified all instances of peak to trough drawdowns experienced by the US equities market since early 2022.
With Tri-X, our subscribers not only have an end-to-end automated trading solution that automatically identifies, executes and exits good reward to risk ratio trades, but also have additional benefits in accurately identifying stock market bottoms. This additional feature of Tri-X will greatly benefit traders and investors that also perform discretionary trades on their own in the following manner:
Traders that trade US Index Futures or ETFs
Stock Investors that often buy more of their favourite long term shares during market selldowns/dips
Swing traders
Please note that all the information contained in this newsletter is intended for illustration and educational purposes only. It does not constitute any financial advice/recommendation to buy/sell any investment products or services.


