Introduction
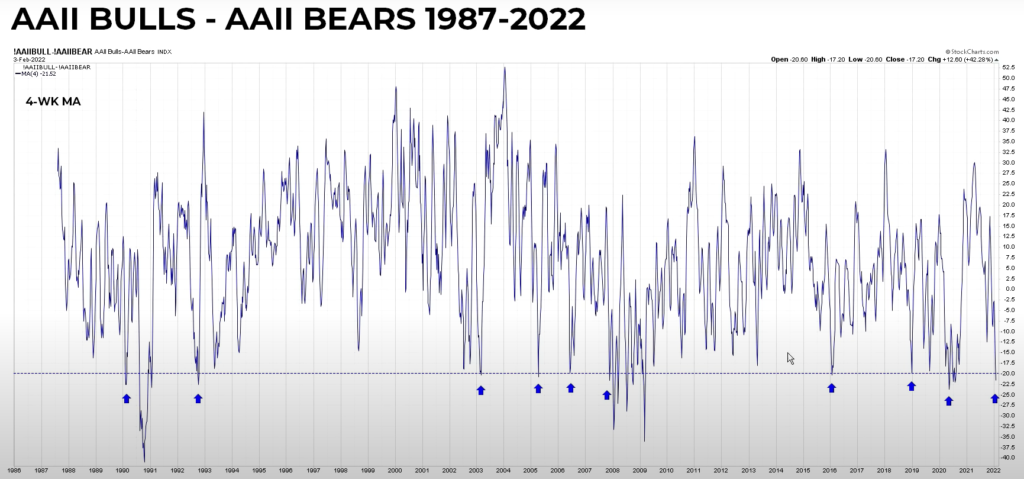
Did you know that the AAII (retail) sentiment survey results provided a rare signal on the 3rd February 2022, that was only seen 9 previous times in the past 35 years?

Source: https://www.ccmmarketmodel.com/
Basically, the number of market participants that were bullish (AAII Bulls), minus those that were bearish (AAII Bears), reached the -20 level mark on 3rd Feb 2022. Including the reading as of 3rd Feb 2022, this makes it the 10th time this has occurred since 1987!
To make sense of this signal, just visually based on the number of people AAII surveyed, what was the difference between those that were bullish versus those that were bearish. So the -20 level means there are more bears than bulls, with 0 being equal quantities of bulls and bears.
Are you interested to learn more about what had historically happened to the stock market the 9 previous times this had occurred? In our latest article, we will break down this data further into what happened when the economy entered a recession versus what happened when it didn’t.
Which were the years where AAII Bulls - AAII Bears dropped below 20?
These were the years where the AAII Bulls – AAII Bears dropped below 20, including the latest reading in 2022.
# | Date |
|---|---|
1 | 9 Feb 1990 |
2 | 9 Oct 1992 |
3 | 7 Mar 2003 |
4 | 15 Apr 2005 |
5 | 16 Jun 2006 |
6 | 30 Nov 2007 |
7 | 29 Jan 2016 |
8 | 4 Jan 2019 |
9 | 15 May 2020 |
10 | 3 Feb 2022 |
Which years preceded a Recession?
Further detail breaking down these into recession/non recession years that preceded these readings are provided. Do note that without the benefit of hindsight, it is impossible to determine whether the present reading (#10) will precede a recession. However we do know what happened to the historical cases in hindsight.
# | Date | Recession? |
|---|---|---|
1 | 9 Feb 1990 | YES |
2 | 9 Oct 1992 | NO |
3 | 7 Mar 2003 | YES |
4 | 15 Apr 2005 | NO |
5 | 16 Jun 2006 | NO |
6 | 30 Nov 2007 | YES |
7 | 29 Jan 2016 | NO |
8 | 4 Jan 2019 | NO |
9 | 15 May 2020 | YES |
10 | 3 Feb 2022 | UNKNOWN |
How did the S&P 500 perform 1 year out following these weak readings?
What may surprise many is that history is showing the S&P 500 had performed very well 1 year after the AAII Bull – AAII Bear readings reached below -20!
1
89% (8 of 9) of the time, the S&P 500 was positive
2
On average, the S&P 500 returned +16.57%
3
The ‘no recession’ cases have occurred in sequence
4
The ‘recession’ cases were isolated and have not occurred in sequence
5
The prior 15 May 2020 case was a recession case
6
If the latest 2022 case were to evolve into a recession case, this will be the first time in history

Recession Cases - Summary
If 2022 were to result in a recession (it is impossible to rule this possibility out as low as the probability is), this is what historically had happened to the S&P 500.
1
75% (3 of 4) of the time, the S&P 500 was positive
2
On average, the S&P 500 returned +13.36%
3
It is not reasonable to expect -40% drawdown or losses

No Recession Cases - Summary
If 2022 were to be a no recession instance (historically this has the highest probability)), this is what historically had happened to the S&P 500.
1
100% (5 of 5) of the time, the S&P 500 was positive
2
On average, the S&P 500 returned +19.13%
3
Historically, the max drawdown from the signal occurring was -5.73% for ‘No Recession’ cases
4
On average the lows took between 5 to 31 days to occur, from the onset of the signal.

Conclusion
- In 2022, 3 Feb a rare retail sentiment signal occurred, with the AAII Bull – Bear level dropping to below -20.
- This had previously occurred 9 times, and the 2022 case is the 10th.
- If history were to repeat (there is no guarantee), the probability of the S&P 500 being positive 1 year out, is 89%.
- It is reasonable to assume the base case for 2022 being a non-recession instance, as two sequential recession instances have not occurred in the past 35 years.
- On average, history suggests a double digit return for the S&P 500 1 year out.
- However, there is no guarantee 2022 cannot evolve into a recession, so traders and investors must be mindful of that.
Please note that all the information contained in this content is intended for illustration and educational purposes only. It does not constitute any financial advice/recommendation to buy/sell any investment products or services.


