
“The bedrock of our economy.”
That’s how Fed Chair Jerome Powell articulated price stability during his recent speech at the Jackson Hole Economic Symposium.
“Without price stability, the economy does not work for anyone,” he continued.
But as we all know, prices in America are soaring across the board.
Americans are paying 75% more for fuel compared to last year. Gasoline is 44% more expensive. Food costs nearly 11% more. And the price of a new car is up more than 10%.
Powell has pledged to take “forceful and rapid steps” to combat such inflation.
Recent GDP data showed the economy contracting by -0.6% in the 2nd quarter after declining by -1.6% in the first quarter of 2022.
As a result, investors have been wondering whether we are currently in a recession or about to enter one.
Simply because…
Two consecutive quarters of negative GDP growth have generally been considered a recession, which we have now technically achieved…
But wait a minute.
The National Bureau of Economic Research (NBER) provides a broader definition of “recession” as the official, agreed-upon arbitrator of a U.S. “recession.”
According to their definition, a recession is characterized by a widespread and prolonged drop in economic activity.
They employ six main datasets published by federal statistical agencies to determine whether or not we’re in a recession:
Real personal income less transfers
Non-farm payroll employment
Employment as measured by the household survey
Real personal consumption expenditure
Whole-sale retail sales adjusted for price changes, and
Industrial production
So, let’s look at all the data sets during past recessions and eventually compare them to the present-day look of the same indicator to determine what exactly is happening in the US economy.
A quick note:
The graphs below depict the performance of each of these data sets during the previous recessions, along with their recent performance:
The shaded areas will show you when the US economy was in a recession.
The blue line is an average of the performance in each measure.
And the red arrows paint the performance of each measure during the respective downturns.
So, without further ado, let’s get started…
1. Real Personal Income Excluding Current Transfers Receipts
The data indicate the income individuals earn from wages and salaries, dividends and interest, ownership of a business, and other sources; personal current transfer receipts are excluded from the calculation.
1980s double whammy recessions:
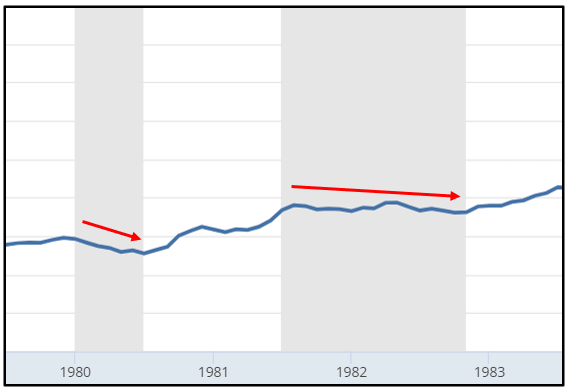
In the 1980s, there were two recessions, the first of which witnessed a significant decline in personal income. Similar scenario for the second one, but performance was more akin to consolidation with a slight decline.

The Dot-com Recession:
After the S&P 500 peaked in early 2000, there was a noticeable drop in real personal income, albeit not as severe.

The Great Recession:
Unsurprisingly, the indicator printed a sharp reversal during the financial crisis in the 2007-2009 window.

The COVID-19 Recession:
A sudden and dramatic drop occurred during the COVID decline in 2020.
You’ll inevitably wonder, “How does this metric currently stack up against previous economic downturns? Does it get better, worse, or stay the same?”
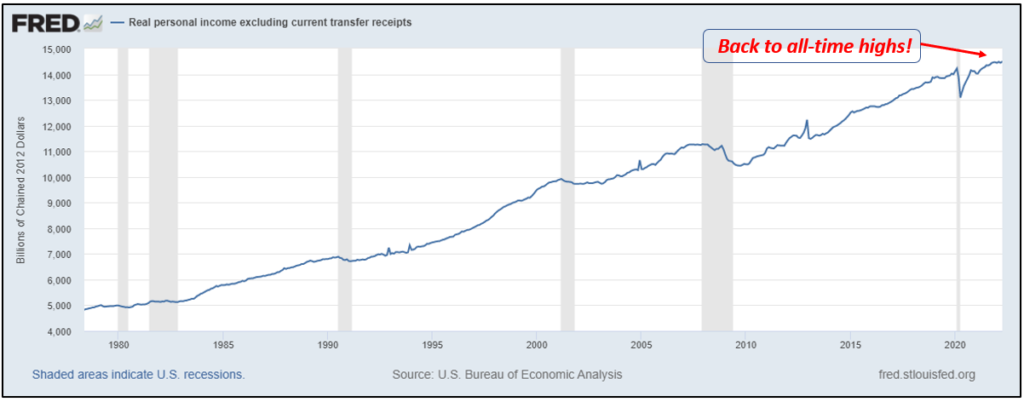
Given the fact that it recently set a new all-time high, it’s much better, and therefore purely based on the ‘Real Personal Income Excluding Current Transfers Receipts’, we are not seeing much evidence of a recessionary indicator compared to historical cases!
And this is notably different from the preceding recessionary eras.
However, nothing can be predicted from the above charts or the data sets. We’re using it to examine the current state of the US economy and determine if we’re in a recession or perhaps on the verge of one, and it is within the realm of possibilities that this indicator may fall to the downside, BUT IT CLEARLY HASN’T YET.
2. Non farm payroll employment
Non-farm payroll employment measures the change in the number of individuals employed over the previous month, excluding the farming industry.

1980s double whammy recessions:
The data set shows a distinct downward trend for both recessions in the 1980s.

The Dot-com Recession:
Again, there was a glaring lack of strength during the 2001 economic downturn.
The Great Recession:
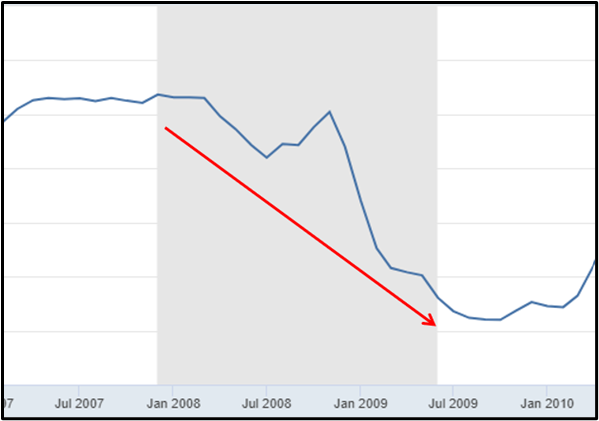
During the 2007-09 recession, the number of people employed in non-farm payroll jobs dropped precipitously, giving the impression of a terrifying roller coaster drop.

The COVID-19 Recession:
The same holds true for the Covid plunge. A significant decline throughout the 2-month recessionary period.
Let’s evaluate the current state of this recession indicator with the preceding downturns:
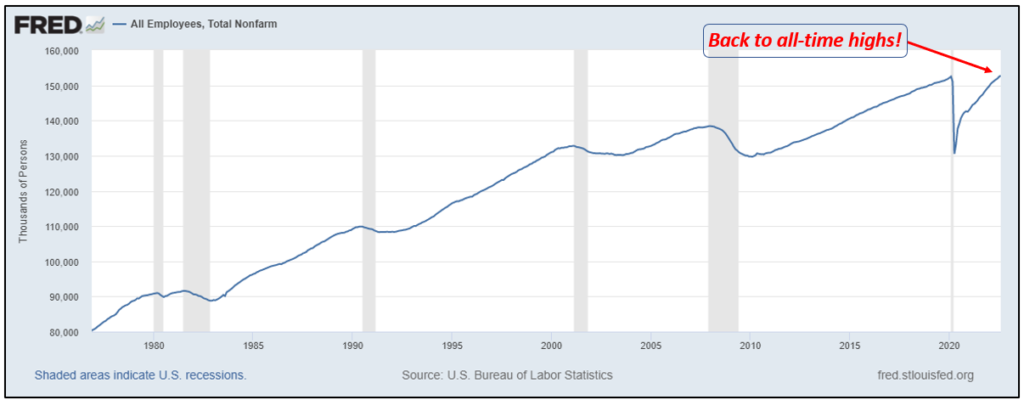
Total non-farm payrolls recently printed a new all-time high.
Consequently, claiming that the current state of the data portends an imminent recession is quite counter-intuitive.
While it’s true that data can and does shift over time, the best we can say about the most recent numbers is that they appear to be consistent with the series’ general upward trend.
3. Employment as measured by the household survey
The following data set indicates the change in the number of people employed over the preceding month. The figure also includes all persons marginally attached to the labor force and the total part-time workers.

1980s double whammy recessions:
The 1980s double-dip recessions showed clear negative trends in overall employment levels.

The Dot-com Recession:
Significant weakness in overall employment level during the downturn followed by the dot-com boom.

The Great Recession:
Similarly situated but with a steeper decline during the 2008–2009 financial crisis.

The COVID-19 Recession:
The employment figures rode the elevator down to multi-year lows!
Having said that, it doesn’t look too bad in 2022; it appears to have stalled a bit, but it’s still very close to record highs:
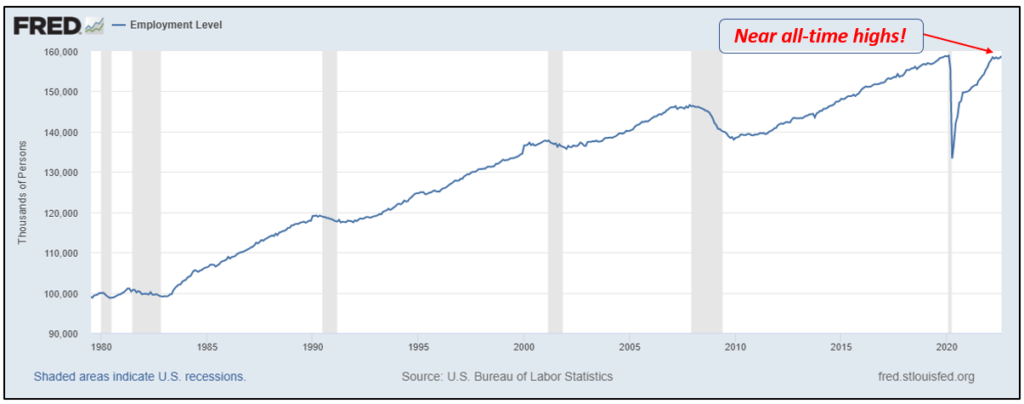
As before, it’s highly questionable to assume that the current state of employment data indicates a forthcoming economic downturn.
4. Real personal consumption expenditures
Real personal consumption expenditures (PCE) is the primary measure of consumer spending on goods and services in the U.S. economy.
In its current form, the data is only available as of 2003, but even that small sample size is quite noteworthy.

The Great Recession:
Fairly obvious to spot the weakness in personal consumption expenditure during the 2007-09 financial crisis.
The COVID-19 Recession:
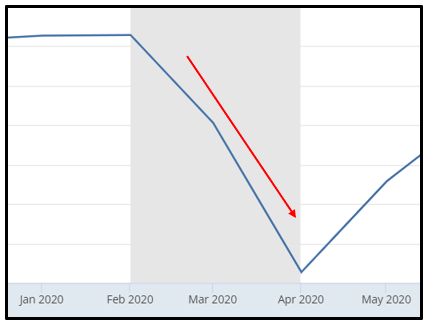
As a defining factor of the Covid recession, a sudden and dramatic drop in value was observed.
So, are current consumer spending patterns similar to or different from those seen in past economic downturns?
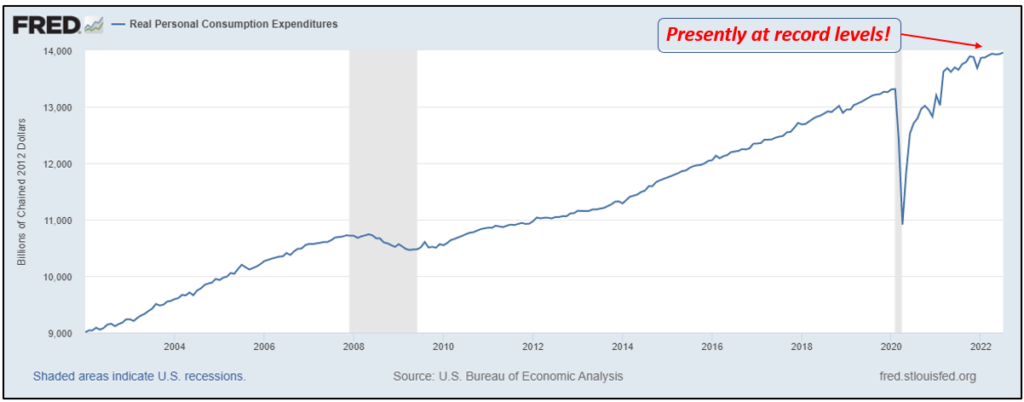
Well, we know the answer…
While it’s possible that the current consumption expenditure trend may soon begin to decelerate, but it’s highly unlikely that consumers will sharply cut back on their spending habits in the near future.
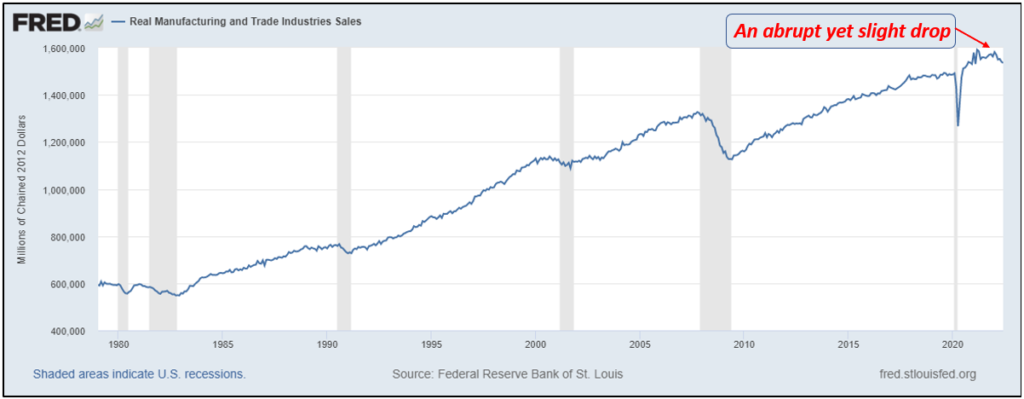
5. Real Manufacturing and Trade Industries Sales
This indicator is a splice of two seasonally adjusted series tracked by the BEA, which follows the total value of all goods manufactured and sold within the U.S.
1980s double whammy recessions:
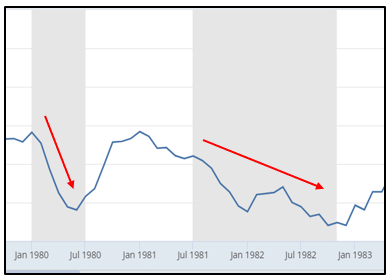
Two consecutive discernible drops during the double dip recessions.

The Dot-com Recession:
A slow and steady decline throughout the dot-com bust recession, indicating a distinct lack of strength.

The Great Recession:
Significant weakness in the value of goods manufactured and sold during the financial crisis recession.

The COVID-19 Recession:
As you might have guessed correctly, a similar steep decline during the Covid recession.
As can be seen in the chart below, there is some deterioration in 2022, but things do not appear to be dreadful at the moment.
It appears more like a typical pullback, but undeniably the pullback may turn into a severe downtrend…
6. Industrial Production
Industrial Production gauges the change in the total inflation-adjusted value of output manufacturers, quarries, and utilities produced.

1980s double whammy recessions:
Industrial production experienced a noticeable and significant decline during the double dip recessions.

The Dot-com Recession:
Similar situation during the dot-com bust bear market.

The Great Recession:
With no surprise, an abrupt decline in industrial production during the financial crisis.

The COVID-19 Recession:
Again, pretty standard waterfall-decline during the Covid recession.
As shown in the chart below, if we compare the present day to the 1980s double-dip recession, dot-com bust bear market, financial crisis and the COVID elevator shaft plunge, it really doesn’t look anything like this:
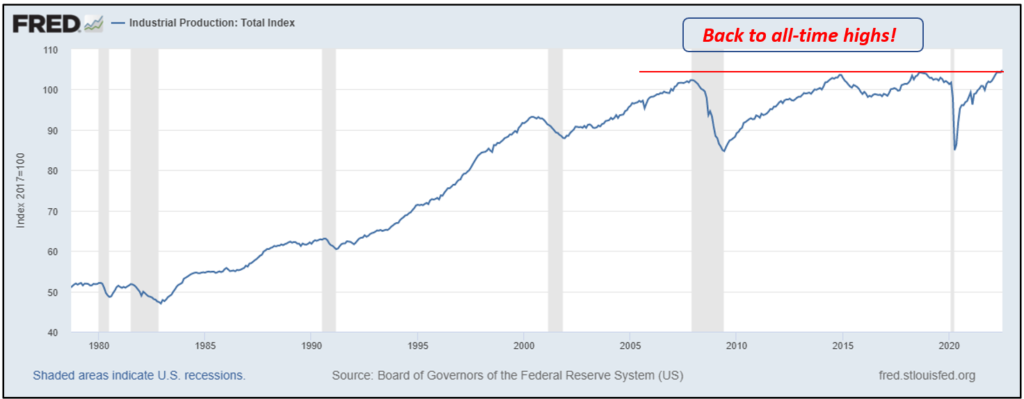
In fact, in 2022, if you zoom in a bit, this indicator just printed a new all-time high, breaking above the pre-covid levels.
What do NBER's recession indicators suggest?
Undoubtedly, we’re examining the information at hand. To put it another way, we are not making any predictions.
This is merely illustrative to aid in answering the questions:
Is the US economy currently in or about to enter a recession? How likely is it that the National Bureau of Economic Research (NBER) will declare a recession in the near future?
Well, that’s to be determined..
But new all-time highs in most of the above data sets don’t sound particularly bearish from a probability perspective.
If we plot all of the data sets from the beginning of the year on a single graph, it is evident, as we have already observed, that only the manufacturing data appear fragile or have been weak in recent months.
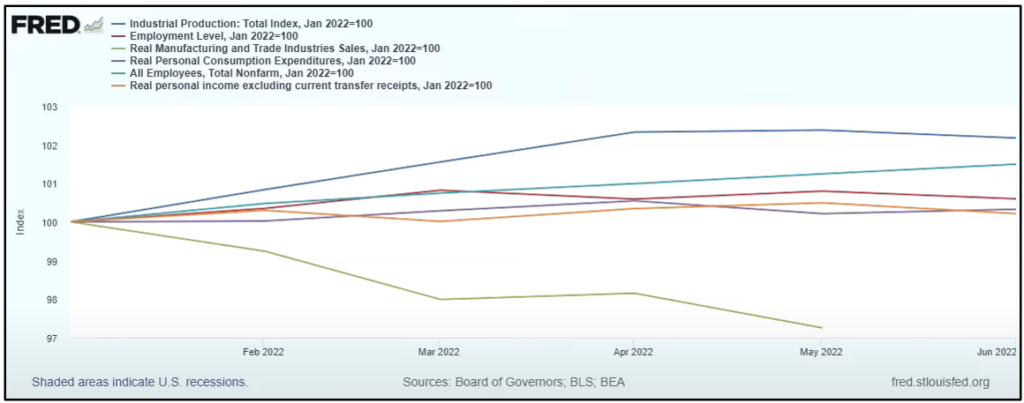
And, from a macroeconomic standpoint, all other economic data points look pretty good, implying that fears of an impending recession are overblown, at least according to the current NBER data.
FINAL WORDS
The U.S. economy has witnessed two consecutive quarters of declining GDP, and even while this is not an official measure, things are certainly not encouraging.
However, the labor market is very strong, consumers are in a resilient position, and industrial output has been hitting all-time highs.
Comparing the present day to the 1980s’ double dip recessions, dot-com bust bear market, financial crisis and the COVID elevator shaft plunge, the current status of NBER recession indicators are far superior!
In fact, this data appears to be consistent with the longer-term secular bull market!
However, it is impossible to ignore the 18.9% decline in the S&P 500 Index since it peaked on January 3, 2022, through September 2, 2022. Bond markets have also struggled with soaring inflation and climbing interest rates.
As investors face elevated market volatility in 2022 due to concerns about persistent inflation and the impact of the Fed’s tightening policy, it may also be helpful to remember that long-term fundamentals ultimately drive stock prices.
Please note that all the information contained in this newsletter is intended for illustration and educational purposes only. It does not constitute any financial advice/recommendation to buy/sell any investment products or services.


