U.S. stocks closed higher on Wednesday, bolstered by strong performances in the Consumer Services, Industrials, and Consumer Goods sectors. The Dow Jones Industrial Average rose 0.56%, while the S&P 500 climbed 0.67%, and the NASDAQ Composite added 0.87%.

Source: Zee Business
On the New York Stock Exchange, advancing stocks outnumbered decliners 1925 to 829, with 99 unchanged. On the Nasdaq Stock Exchange, 2262 stocks rose, 1015 declined, and 138 remained unchanged. The CBOE Volatility Index, which measures the implied volatility of S&P 500 options, decreased by 1.19% to 21.51.
Goldman Sachs, Amazon Lead Dow Gains as Verizon, Chevron Lag
The best performers on the Dow Jones included Goldman Sachs Group Inc (NYSE: GS), which rose 2.67% to close at 563.10, Amazon.com Inc (NASDAQ: AMZN), which added 2.00% to settle at 196.01, and American Express Company (NYSE: AXP), which gained 1.73% to end at 275.15. On the other hand, Verizon Communications Inc (NYSE: VZ) fell 1.41% to 44.74, Chevron Corp (NYSE: CVX) dropped 1.21% to 166.47, and Coca-Cola Co (NYSE: KO) declined 0.77% to close at 71.32.

Source: CNBC
Amentum, Leidos Lead; Hershey, Altria Drop
The top performers on the S&P 500 included Amentum Holdings LLC (NYSE: AMTM), which surged 10.30% to 19.71, Leidos Holdings Inc (NYSE: LDOS), which rose 5.98% to 143.03, and Caesars Entertainment Corporation (NASDAQ: CZR), which climbed 5.80% to 26.27. On the downside, Hershey Co (NYSE: HSY) dropped 3.34% to 163.95, Altria Group (NYSE: MO) lost 2.84% to 57.12, and MarketAxess Holdings Inc (NASDAQ: MKTX) fell 2.37% to 210.81.

Source: 24/7 Wall St
American Rebel Soars 341% as Jayud Plummets 96%
The NASDAQ Composite saw impressive gains from American Rebel Holdings Inc (NASDAQ: AREB), which soared 341.90% to 6.28, Innovation Beverage Group Ltd (NASDAQ: IBG), which rose 152.46% to 1.25, and Sportsmans (NASDAQ: SPWH), which climbed 97.93% to 1.91. On the other hand, Jayud Global Logistics Ltd (NASDAQ: JYD) saw a sharp 95.67% drop to 0.35, ReShape Lifesciences Inc (NASDAQ: RSLS) lost 71.69% to 0.45, and BingEx Inc (NASDAQ: FLX) declined 56.90% to 2.25.

Source: Yahoo Finance
Gold Gains 1.45%, Oil Mixed, Dollar Slips
Gold Futures for June delivery gained 1.45%, or 45.75 points, to close at $3,191.75 per troy ounce. Crude oil for delivery in May rose 0.27%, or 0.19 points, to hit $71.39 per barrel, while the June Brent oil contract increased by 0.03%, or 0.02 points, to trade at $74.51 per barrel.

Source: FXStreet
In the currency markets, the EUR/USD pair remained unchanged at 1.08, while USD/JPY decreased by 0.21% to 149.69. The US Dollar Index Futures fell 0.43%, closing at 103.51.
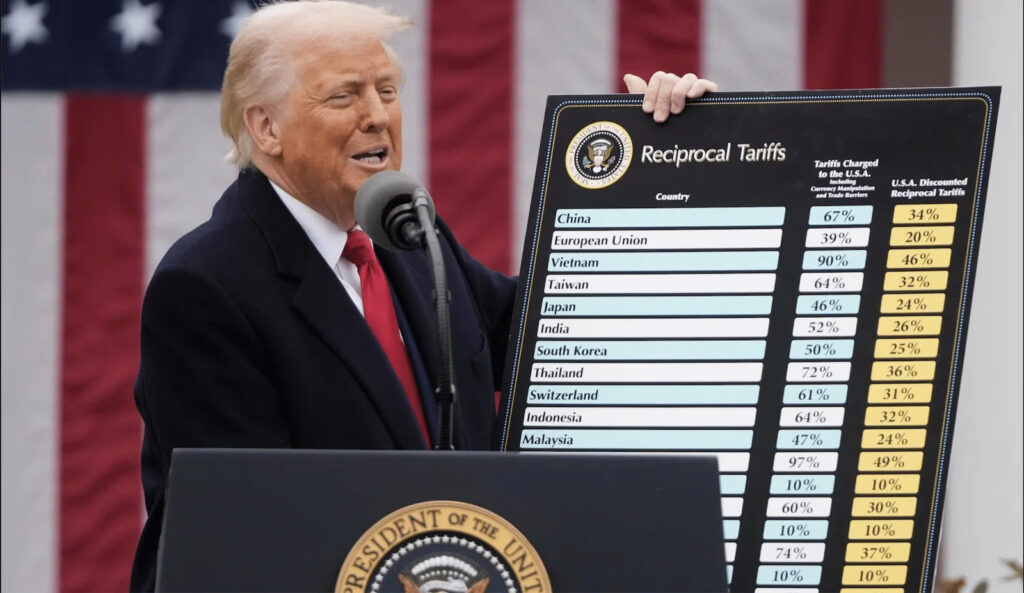
Markets Plunge as Trump Unveils Sweeping New Tariffs
After the close of regular trading, President Trump unveiled a sweeping new tariff plan, which immediately rattled investor confidence. The U.S. will impose a 10% baseline tariff on all imports starting April 5, 2025. On top of that, higher tariffs of up to 34% will be placed on Chinese goods, along with additional tariffs for countries the U.S. considers “bad actors” in trade. This tariff overhaul, intended to address trade imbalances, sent shockwaves through the markets.
For China, Trump’s new tariffs add to previous duties, bringing the total effective tariff on Chinese imports to 54%. The European Union is set to face a 20% tariff, with the EU already indicating its readiness to retaliate if negotiations do not resolve the issue. Meanwhile, Canada and Mexico remain exempt from the reciprocal tariff regime but still face other U.S. duties related to issues like the fentanyl crisis.
Source: The Plunge Daily
Following the announcement, stock-index futures for the U.S. markets fell sharply by more than 2.5% in after-hours trading. Asian markets were hit hard, with Japan and South Korea experiencing significant declines, particularly in sectors like electronics and automotive, which are heavily impacted by these tariffs. Popular U.S. companies such as Apple, Amazon, and Nike also saw substantial declines in post-market trading as investors assessed the negative impact on their global supply chains and profitability.

Investment Opportunity & Risk
Apple Inc. (NASDAQ:AAPL)
On Wednesday, Tigress Financial Partners reaffirmed their Strong Buy rating on Apple Inc. (NASDAQ:AAPL) and raised their price target to $300, citing confidence in the company’s accelerating growth in services and innovation, as well as its expanding customer base. Despite trading above its Fair Value according to InvestingPro analysis, the stock still shows a 14% potential upside based on analysts’ average price targets. Apple’s record 2.2 billion active devices and over 1 billion paid subscriptions contribute to its strong service revenue. With a market cap of $3.37 trillion and a P/E ratio of 35.4x, Apple also enjoys a 46.5% gross profit margin. The company’s advancements in Apple Silicon and AI, including its Tap to Pay and Private Cloud Compute features, reinforce its innovation and security commitment. Tigress Financial also praised Apple’s $30 billion return to shareholders in Q1.
Analysts remain optimistic about its position, brand equity, and profitability, forecasting a 30% return from the new target price. In other news, Visa has made a $100 million bid to replace Mastercard as the network for the Apple credit card, and despite a 1% decline in global iPhone sales, Apple saw a 20% sales increase in India. Criticisms of Apple’s product quality and financial strategy continue, but analysts like Citi maintain a Buy rating with a target price of $275.
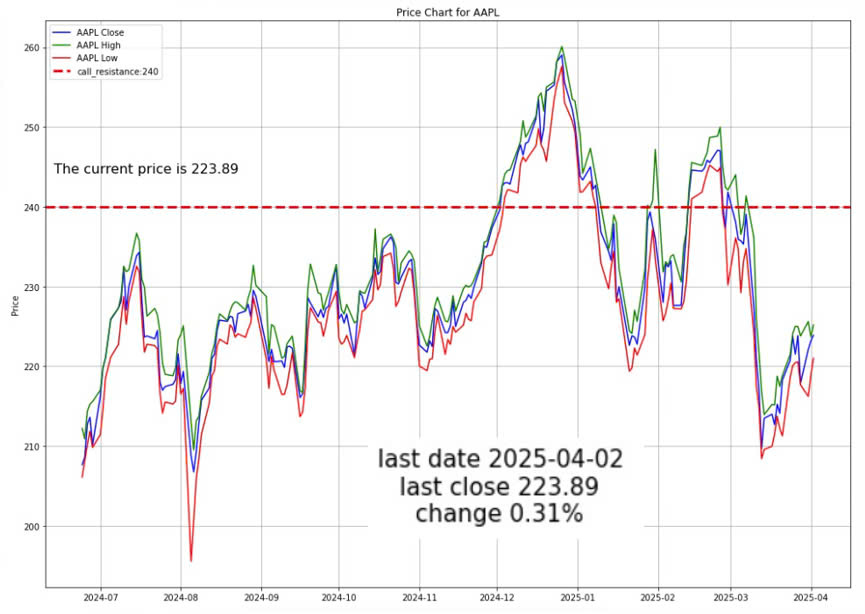
Option Smile Chart for AAPL
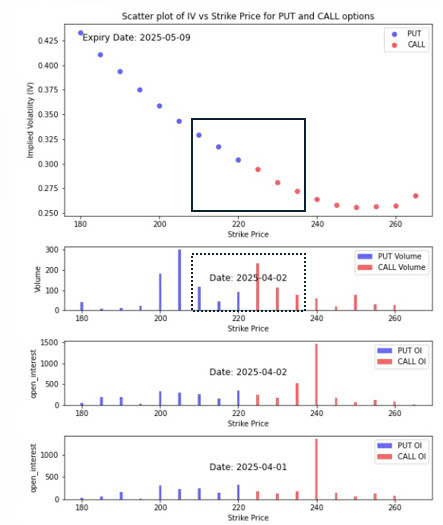
- Our in-house system assigns a bullish index score of 0.542 on a scale where 0 represents completely bearish and 1 represents completely bullish.
- The implied volatility of the strikes close to the stock price (ATM) shows that average implied volatility of the put option is bigger than that of the call option. This indicates that the traders’ fear for the stock price to fall is greater than the traders’ fear that the stock price will rise.
- The volume chart shows that the traders are betting more for the stock price to rise than to decline. Aggregately they set the next target price at 225.
- The open interest chart doesn’t show any meaningful put induced support. There is however, a major call induced resistance level of 240.
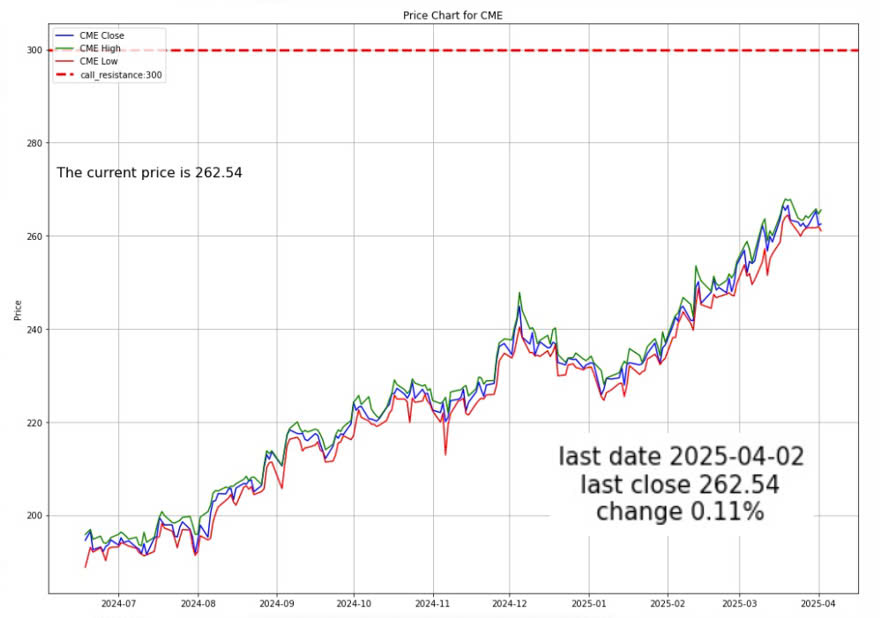
CME Group (NASDAQ:CME)
On Wednesday, Raymond James maintained an Outperform rating and a $287 price target for CME Group (NASDAQ:CME), citing the company’s strong performance in a volatile macroeconomic and geopolitical climate. CME’s recent trading volumes, particularly in rate futures and Treasury futures, have exceeded expectations, with its energy futures business also showing a positive turnaround. The company has experienced 9.9% revenue growth and boasts a $94.78 billion market cap. Analysts expect CME’s valuation multiple to expand as concerns about competition and Federal Reserve rate cuts diminish. Despite the stock trading slightly above its Fair Value, the firm views the risk/reward profile as favourable. CME’s diverse risk management offerings have benefited from increased market volatility, which has driven higher trading volumes. In recent news, CME reported a record average daily volume of 29.8 million contracts in Q1 2025 and launched Solana futures contracts, reflecting growing institutional interest in digital assets.
Additionally, CME is set to introduce new Bloomberg Commodity Subindex futures. Erste Group initiated coverage with a Buy rating, while Moody’s upgraded CME’s corporate family rating. These developments highlight CME’s commitment to innovation and expansion in response to evolving market needs.
Option Smile Chart for CME
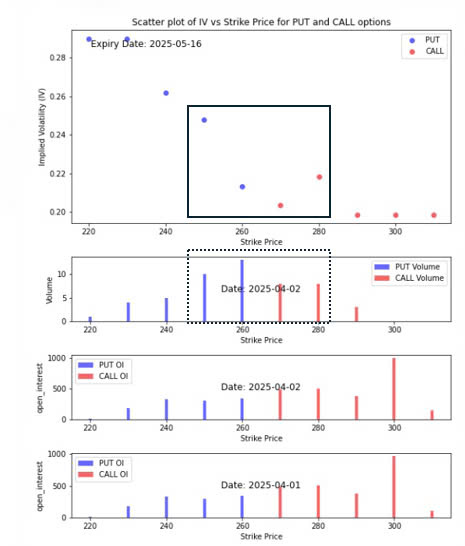
- Our in-house system assigns a bullish index score of 0.5 on a scale where 0 represents completely bearish and 1 represents completely bullish.
- The implied volatility of the strikes close to the stock price (ATM) shows that average implied volatility of the put option is bigger than that of the call option. This indicates that the traders’ fear for the stock price to fall is greater than the traders’ fear that the stock price will rise.
- The volume chart shows that the traders are betting more for the stock price to drop than to decline. Aggregately they set the next target price at around 255.
- The open interest chart however, indicates a bullish undertone and indicates a call induced resistance level at 300 which is pretty close to the price target estimated by Raymond James.
CONCLUSION
- U.S. stocks closed higher during regular trading, with strong gains in Consumer Services, Industrials, and Consumer Goods sectors.
- Market sentiment turned sharply negative after Trump’s post-market announcement of sweeping new tariffs.
- A 10% baseline tariff on all imports and higher tariffs on Chinese goods triggered concern over global trade.
- Stock-index futures dropped significantly in after-hours trading, with sharp declines in Asian markets.
- Major U.S. companies like Apple, Amazon, and Nike saw notable losses due to global supply chain concerns.
- Despite the tariff shock, gold and oil prices posted gains, reflecting investor shifts toward safe-haven assets.
- The impact of new tariffs is expected to influence market volatility and investor sentiment in the coming days.
Please note that all information in this newsletter is for illustration and educational purposes only. It does not constitute financial advice or a recommendation to buy or sell any investment products or services.
About the Author

Rein Chua is the co-founder and Head of Training at AlgoMerchant. He has over 15 years of experience in cross-asset trading, portfolio management, and entrepreneurship. Major media outlets like Business Times, Yahoo News, and TechInAsia have featured him. Rein has spoken at financial institutions such as SGX, IDX, and ShareInvestor, sharing insights on the future of investing influenced by Artificial Intelligence and finance. He also founded the InvestPro Channel to educate traders and investors.
Rein Chua
Quant Trader, Investor, Financial Analyst, Vlogger, & Writer.