
At the start of 2025, the U.S. stock market has faced heightened uncertainty and volatility, driven by shifting consumer confidence, Federal Reserve policy decisions, and key economic indicators. On Wednesday, U.S. stock indexes fell sharply as the Fed held interest rates steady for the first time since September, pausing its rate-cutting efforts. Investor sentiment worsened as concerns over China’s aggressive AI expansion rattled Big Tech, adding to broader market unease. The Wall Street’s decline reflects these developments, with fears surrounding Fed policy and China’s AI ambitions weighing on the market. This report examines recent trends in consumer confidence, Fed actions, and their impact on the stock market.

Source: First Command
Consumer Confidence Dips as Trump’s Second Term Begins
U.S. consumer confidence weakened for the second consecutive month in January 2025, reflecting growing concerns about current and future economic conditions at the beginning of President Trump’s second term. The Conference Board’s consumer sentiment index fell by 5.4 points to 104.1, below economists’ expectations of 106.0. This decline was primarily driven by younger consumers (under 55 years old), while those over 55 saw a slight increase in confidence.

Source: WSJ
The survey, conducted before Trump’s inauguration on January 20, revealed that consumers remain cautious about the future, particularly regarding employment prospects and inflation. Year-ahead inflation expectations rose to 5.3% in January, up from 5.1% in December. Despite these concerns, consumers remained optimistic about the stock market, with more than half expecting stock prices to rise in the coming year.
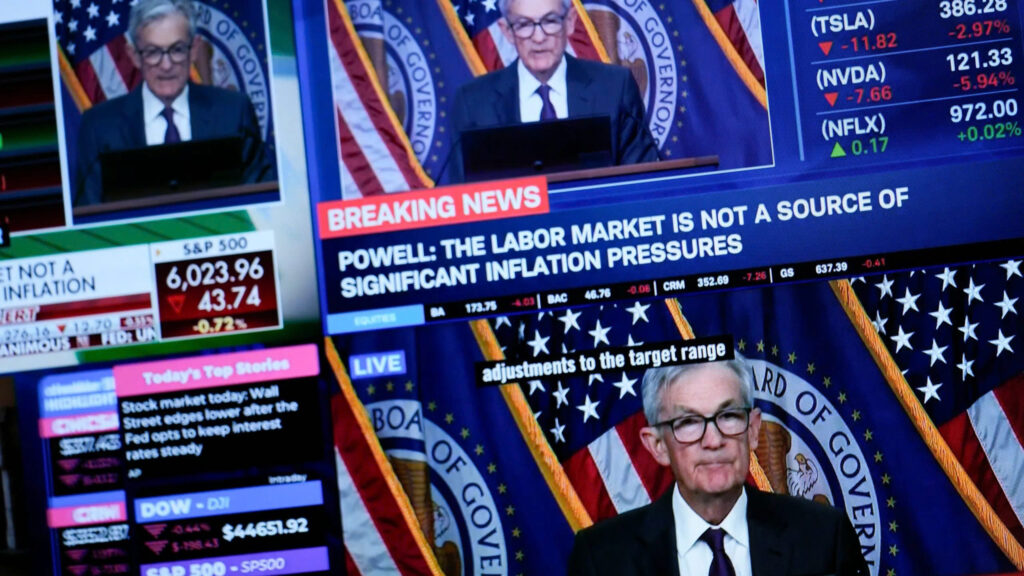
Fed Holds Rates, Takes Wait-and-See Approach
The Federal Reserve decided to maintain the benchmark federal funds rate at a range of around 4.3% during its January 2025 meeting, pausing after three consecutive rate cuts in 2024. Fed Chair Jerome Powell emphasized that the central bank is in a “wait-and-see” phase, stating that further rate cuts would require “real progress on inflation” or unexpected labor market weakness.
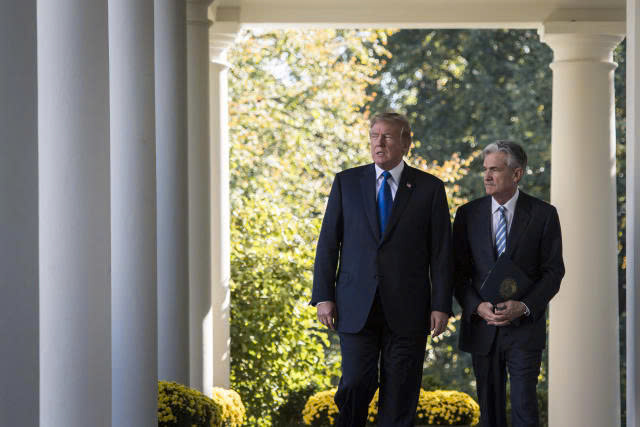
Powell expressed optimism that inflation would continue to slow but stressed the need for tangible evidence before adjusting rates. The Fed’s decision drew criticism from President Trump, who accused the central bank of allowing inflation to accelerate and promised to curb price increases through energy production, deregulation, and trade rebalancing.
Source: WJTV
Market reactions to the Fed’s decision were mixed. While stocks initially extended losses following the announcement, Powell’s reassuring comments helped pare back some of the declines. The Dow Jones Industrial Average fell by 0.31%, the S&P 500 dropped by 0.47%, and the Nasdaq Composite declined by 0.51%. Technology shares, particularly Nvidia and Microsoft, were among the hardest hit, partly due to concerns over competition from Chinese AI startups.
Market Cautious as Trump’s Tariffs and Fed Policy Weigh on Outlook
Investors remain cautious amid uncertainty surrounding President Trump’s proposed tariffs and their potential impact on inflation and economic growth. The Fed’s decision to hold rates steady has led to reduced expectations for rate cuts in 2025, with traders now pricing in around 44 basis points of cuts by year-end, down from 48 basis points before the Fed’s announcement.
Source: Yahoo Finance
The December reading of the personal consumption expenditures (PCE) price index, a key inflation metric, is expected to provide further clarity on the inflation trajectory. Meanwhile, corporate earnings reports, such as Microsoft’s slower-than-expected growth in its Azure cloud business, have added to market volatility.
WATCHOUT
Nvidia Slides 6.6% Amid China Concerns and Rising AI Competition
Nvidia‘s stock dropped by 6.6% despite strong earnings from ASML and other chipmakers. This decline follows reports of potential new U.S. restrictions on Nvidia’s chip sales to China, particularly the H20 chips. Investors were also spooked by the emergence of DeepSeek, a Chinese AI startup whose low-cost AI models could rival those from Nvidia and its competitors. While ASML’s strong earnings bolstered confidence in the chip sector, Nvidia’s shares continued to struggle, as analysts questioned whether the DeepSeek model’s lower costs might reduce the need for expensive AI infrastructure, potentially impacting Nvidia’s prospects.

Option Smile Chart for NVDA
- Our in-house system assigns a bullish index score of 0.696 on a scale where 0 represents completely bearish and 1 represents completely bullish.
- The scatter plot of the implied volatility smile shows that the fear of the drop in the stock price outweighs the greed sentiment that the stock price will rise.
- The volume chart however tells a different story, despite the greater fear than greed, more traders are placing bets that the price will rise with the volume spikes at strike prices 125, 130, 140 and 145. For the bearish perspective, many traders are buying protection at the strike price 120.
- The open interest chart indicates that if the stock turns south, it may fall into a “bottomless” pit. And if the price rises, the immediate resistance is at the strike price 125. The next resistance after that are at 130 and 140.

Investment Opportunity & Risk
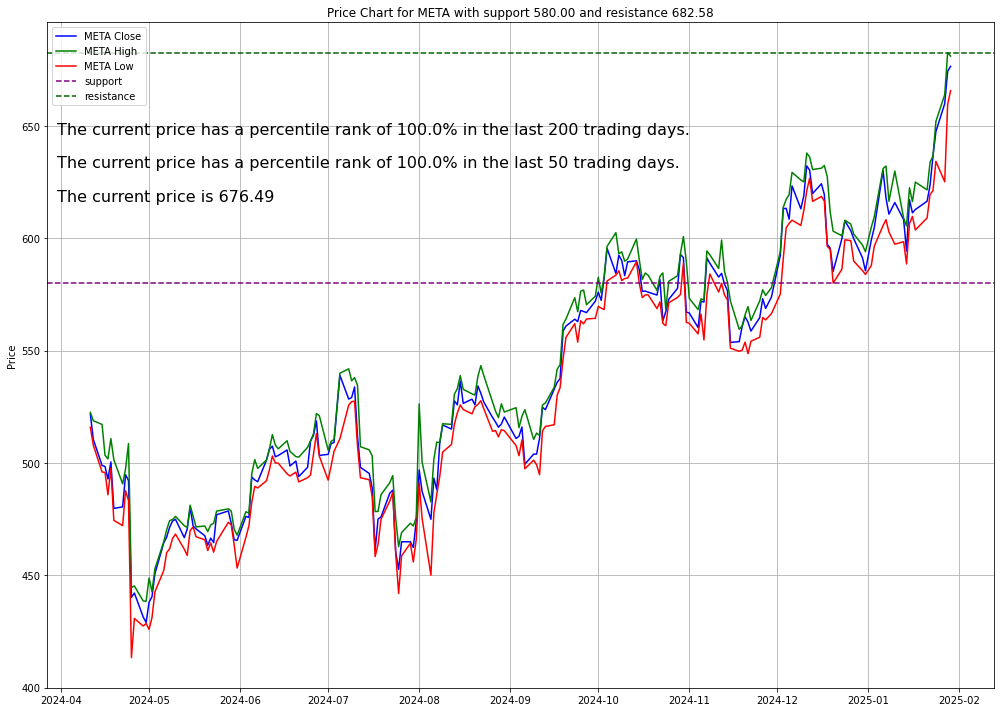
META (NASDAQ: META)
Meta Platforms reported strong Q4 earnings, surpassing expectations with a 50% increase in earnings per share to $8.02 and a 21% year-over-year revenue growth to $48.4 billion. The company’s revenue growth was driven by a 6% increase in ad impressions and a 14% rise in ad prices. However, its Q1 revenue outlook was softer than anticipated, with projections ranging from $39.5 billion to $41.8 billion.
Meta also plans significant capital expenditure in AI data centers, with a projected 59% increase in 2025, though some analysts question whether new AI models like DeepSeek might reduce future costs. Despite Reality Labs’ sluggish performance, with a 7% increase in operating loss, Meta’s stock saw a slight rise in after-hours trading. Additionally, Meta settled a lawsuit with Donald Trump over his Facebook suspension.
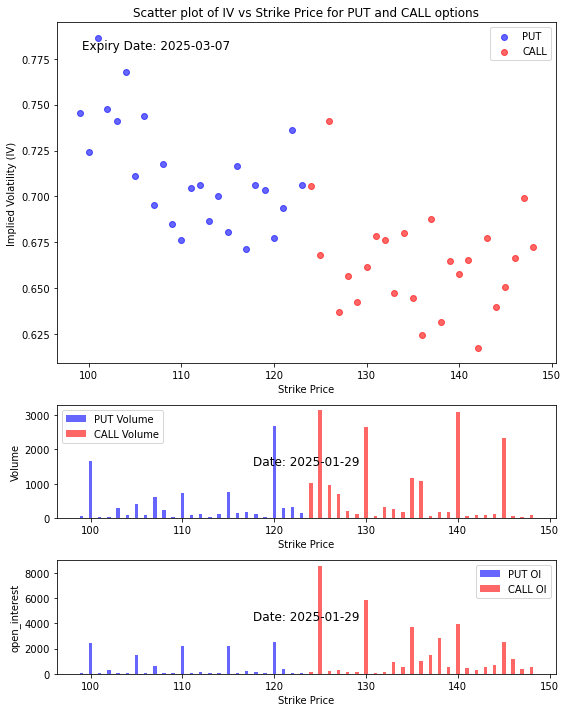
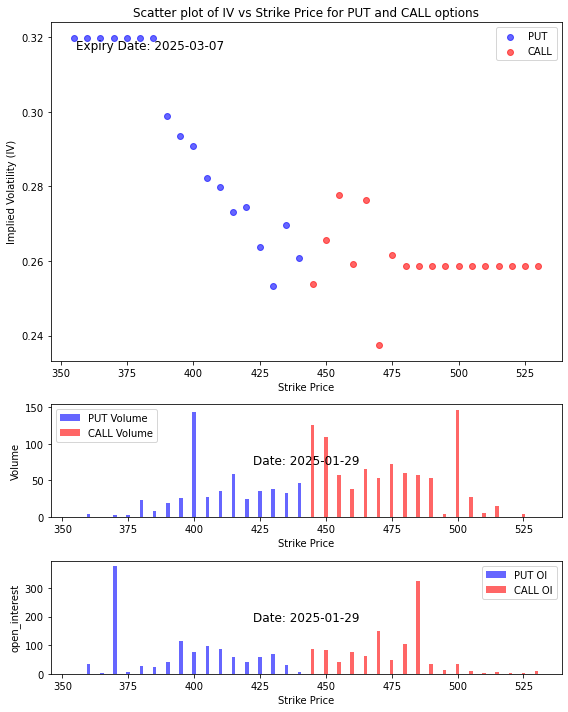
Option Smile Chart for META
- Our in-house system assigns a bullish index score of 0.622 on a scale where 0 represents completely bearish and 1 represents completely bullish.
- The scatter plot of the implied volatility smile shows that the fear of the drop in the stock price is slightly higher than the greed sentiment that the stock price will rise at strike prices close.
- The volume chart however tells that more traders are placing bets that the price will rise with the volume spike at strike prices 700. For the bearish perspective, many traders are buying protection at the strike price below 610.
- The open interest chart indicates that if the stock turns south, it may fall all the way to 625 support level. And if the price rises, the resistance is at the strike price 700.
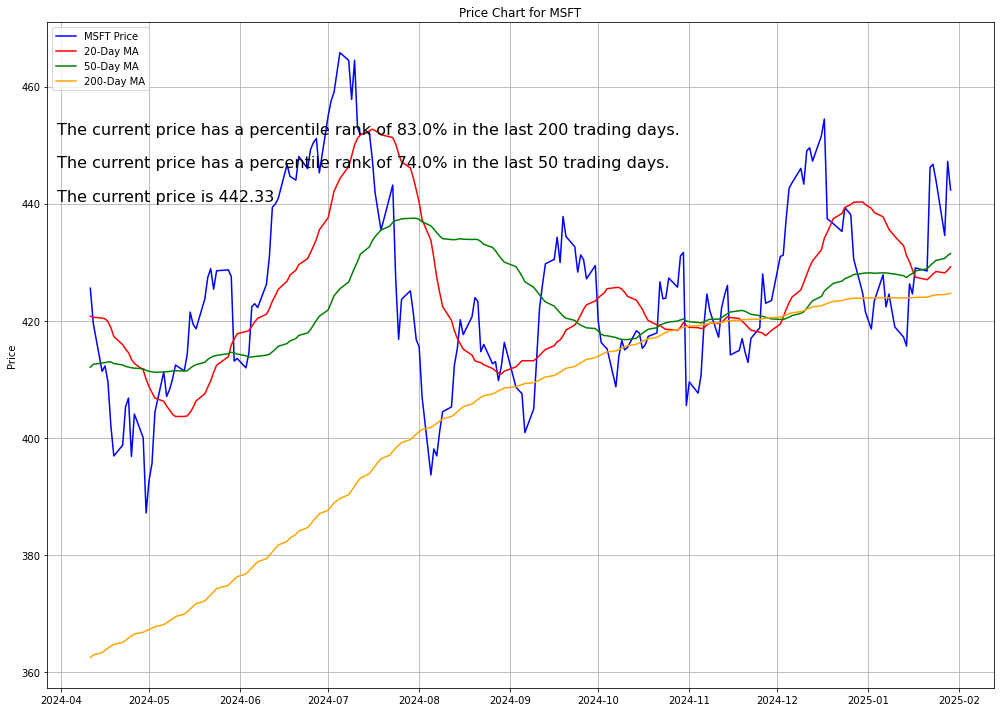
Microsoft (NASDAQ: MSFT)
Microsoft reported strong Q2 earnings, exceeding analyst expectations with earnings of $3.23 per share on revenue of $69.6 billion. Despite the positive results, the stock dropped due to slower-than-expected growth in Azure and cloud services, which increased by 31% compared to 33% in the previous quarter. The company also revealed a significant rise in capital expenditures, with $15.8 billion spent in the quarter, driven by investments in AI infrastructure.
Investors are concerned about the high costs of AI, especially after the emergence of DeepSeek, a Chinese AI startup claiming to have created a model at a fraction of the cost. Microsoft plans to invest $80 billion in AI in 2025, but concerns about the efficiency of these expenditures weighed on the stock, which fell by 5% in after-hours trading.
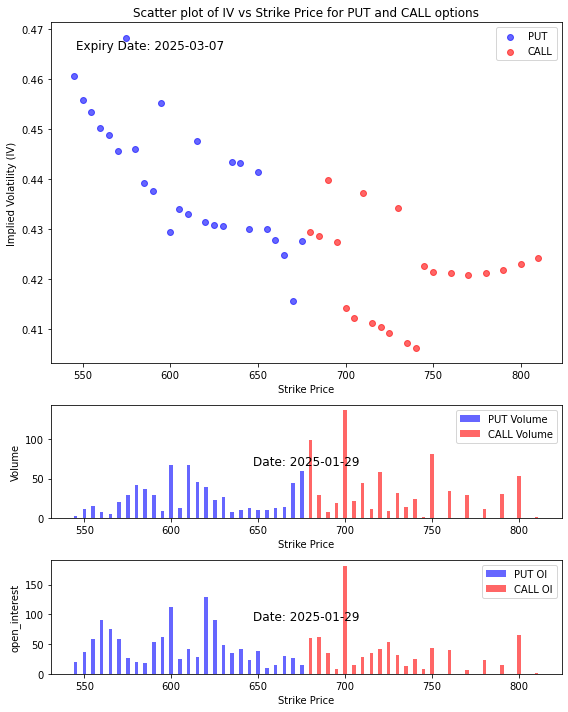
Option Smile Chart for MSFT
- Our in-house system assigns a bullish index score of 0.687 on a scale where 0 represents completely bearish and 1 represents completely bullish.
- The scatter plot of the implied volatility smile shows that the fear of the drop in the stock price is about even with the greed sentiment that the stock price will rise at strike prices close to the current stock price.
- The volume chart however tells that more traders are placing bets that the price will rise with the volume spikes at strike prices 445, 450 and 500. For the bearish perspective, many traders are buying protection at the strike price 400.
- The open interest chart indicates that if the stock turns south, it may fall all the way to 370. And if the price rises, the resistance is at the strike price 485.
CONCLUSION
- U.S. stock market facing challenges due to declining consumer confidence and cautious Federal Reserve policy.
- Fed’s decision to hold rates steady aims to control inflation but leaves market uncertain.
- Investor sentiment influenced by geopolitical factors and corporate performance.
- Key economic indicators and policy decisions will be crucial for shaping market trends in 2025.
Please note that all information in this newsletter is for illustration and educational purposes only. It does not constitute financial advice or a recommendation to buy or sell any investment products or services.
About the Author

Rein Chua is the co-founder and Head of Training at AlgoMerchant. He has over 15 years of experience in cross-asset trading, portfolio management, and entrepreneurship. Major media outlets like Business Times, Yahoo News, and TechInAsia have featured him. Rein has spoken at financial institutions such as SGX, IDX, and ShareInvestor, sharing insights on the future of investing influenced by Artificial Intelligence and finance. He also founded the InvestPro Channel to educate traders and investors.
Rein Chua
Quant Trader, Investor, Financial Analyst, Vlogger, & Writer.