Introduction
Did you know that ‘Market Breadth’ data has been very weak? In fact, a weak market breadth data signal was present in 2007, just before the great Financial Crisis occurred in 2008.
Precisely because of this, many analysts and financial news commentators are comparing the current market conditions with 2007/2008, and are calling for a major correction/selldown to occur.
Perhaps there may be some truth in this comparison, because inflation is high and the Fed recently announced they will be scaling back on their accommodative monetary policy as well as starting a path of raising interest rates as early as 2022 next year!
Furthermore, we all know how the stock market is hooked on monetary liquidity like steroids, and perhaps when liquidity tightens the stock market will have to go down.
Does the current weak ‘Market Breadth’ data support this thesis?
Read on to find out more!
What is Market Breadth?
Market breadth data is essentially a calculation that determines the number of advancing or declining stocks that are listed on public exchanges.
This data is very interesting, because it provides a broad measure of how well the entire stock market is doing compared to the popular stock market indices like Dow 30, S&P 500 and Nasdaq 100 which are propped up by a handful of stocks with heavier weights.
In general, when the stock market ( Dow 30, S&P 500 and Nasdaq 100) is extremely bullish, expectations are also for market breadth data to show more advancing issues compared to declining issues.
When the stock market ( Dow 30, S&P 500 and Nasdaq 100) is extremely bearish, market breadth data tends to show extreme levels of declining issues.
What is the ‘Total Market Decline’ Signal?
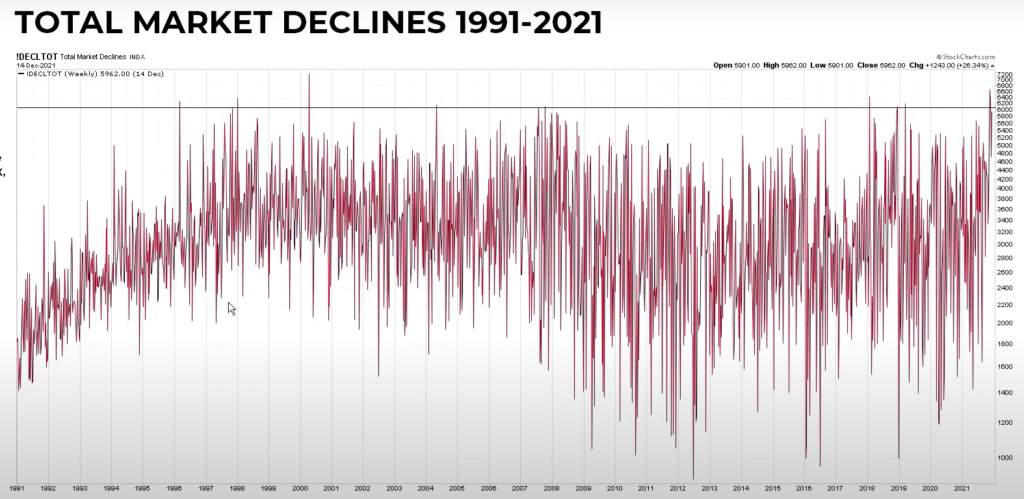
Did you know that a rare data signal just occurred, that had previously occurred only 9 other instances in the past 30 years since 1991?
That rare data signal is called ‘Total Market Declines’.
The definition for this indicator measures the total number of stocks listed in the 3 major US stock exchanges, AMEX, NASDAQ, and NYSE that have shown a decrease in price compared to the previous historical day/week/month close.
Source:https://www.ccmmarketmodel.com/short-takes/bubble-ready-to-burst
First off, it is quite rare to find ‘Total Market Declines’ exceeding the 6000 level mark. This means that at those points in time, 6000 or more stocks listed in all 3 exchanges have sold off, resulting in a decrease in price compared to their previous close.
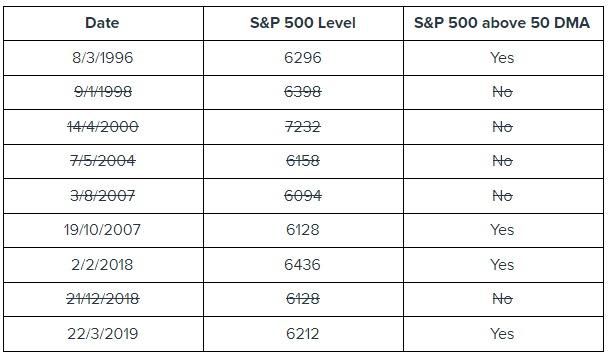
In this past 30 years, this signal has occurred 9 times historically and the table summarises the results:

Extremely Rare ‘Total Market Decline’ with Bullish S&P 500 Signal just occurred
Did you know that an even more rare data signal in conjunction with ‘Total Market Decline’ just occurred, that had previously occurred only 3 other instances in the past 30 years since 1991?
Based on the table displayed above, if we were to add another indicator ‘S&P 500 above 50 Day Moving Average’, in addition to the 2021 case, this signal showed up only thrice historically.
What are we trying to Model?
By adding the indicator ‘S&P 500 above 50 DMA’ in conjunction with ‘Total Market Declines’ data, what we are essentially trying to find are rare situations in the past 30 years where market breadth data is extremely weak (as seen in ‘Total Market Declines’), but yet the S&P 500 is still bullish (as seen in ‘S&P 500 above 50 DMA’).
This means we are looking for rough undercurrents despite a calm sea at the surface.
What does history say about S&P 500 performance following this rare signal?
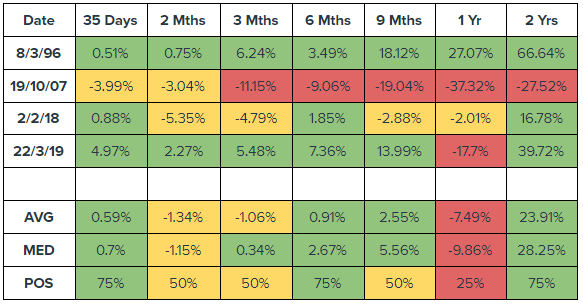
Analysing the S&P 500 returns, in the previous 4 instances where this rare signal had occurred, shows that moving forward from 1 month to 2 years, the stock market is likely to range from wildly bullish to wildly bearish.
If the 1996 and 2019 cases were to repeat, the S&P 500 will be mostly range-bounded in the next 6 months, before resuming a bullish run for the next 1 (only for 1996) to 2 years.
If the 2007 case was to repeat, it signalled the start of a prolonged recession that will only recover in 2009-2010.
If the 2018 case were to occur, the S&P 500 will be very volatile as it will mostly sideways trade for 1 year, before resuming a bullish trend.
Conclusion
Based on the rare signal above, which had only occurred 4 other times in the past 30 years, the S&P 500 market performance is definitely not clear cut bullish going forward.
Perhaps this is within expectations when the stock market breadth data is poor (strong undercurrents) while the market index on the surface appears to be robust and strong.
What is also very clear from the 4 previous cases, when the S&P 500 is strong but market breadth is lopsidedly weak, is that positive market returns will likely be muted for the next 6 months at least.
Therefore, many professional traders, analysts and stock investors are getting ready for a tough 2022! The reason is because the stock market has run up a lot since the Covid lows, and the stock market is overpriced with high valuations. Coupled with the Fed making financial less accommodative than we had seen in the past 2 years, the only natural thing is for the stock market to take a break.
Hence, the US stock market is expected to either trade sideways or in the worst case, experience a correction in 2022.
Do you know that when markets trade sideways or enter into correction territory, AlgoMerchant’s fully automated AI trading strategies are designed to exploit such market conditions?
If you are keen to explore alternative ways to profit from a tough market next year, we have an upcoming VIKI seminar. Click the link below to register for the event to learn how VIKI can profit when the market cannot!
Please note that all the information contained in this content is intended for illustration and educational purposes only. It does not constitute any financial advice/recommendation to buy/sell any investment products or services.


