Introduction
Did you know that when oil prices double (or more) within a year, the probability of bad things happening to the economy and stock market increases?
According to Refinitiv, some of these prior occurrences have resulted in recessions, for example the cases in 1974, 1980 and 2001.
In other situations, recessions started at the same time oil prices made volatile bullish moves like in 1990 and 2008.
However, there are other extremes, such as the case in 2017, when oil doubled in a year but the S&P 500 had an amazing year.
If you look at the chart below, something clearly stands out, the 2022 recent Brent Crude 1 year change (~300%) mirrors only the 1974 case, yet that did not occur with the context of a recession. In fact we had only just come out of a Covid recession.
Since much comparison has been made of our current situation to the 1970s, which bore witness to the Arab oil embargo and the Iranian revolution, let’s evaluate if they offer valuable templates for what could happen next.

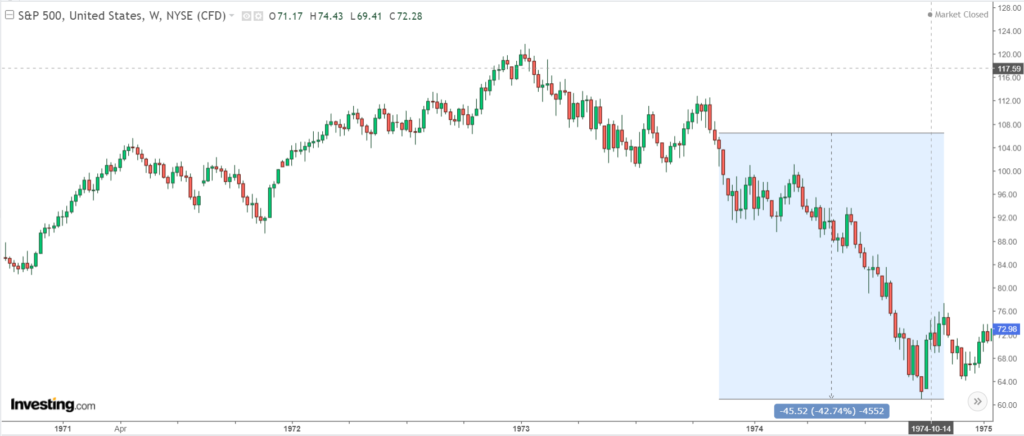
What happened in 1973-1974?
The Arab oil embargo of the 1973-1974 has been touted as the most similar historical event to today.
Back then, oil prices shot off the roof because several allied Middle Eastern dictatorships (Syria and Egypt) embarked on destructive land grab campaigns. Israel, a tough defender, fought against her enemies surprisingly well.
Similar to the current Ukraine situation, the USA did not join the fight, but supplied significant American weapons to the Israelis.
That episode caught the Federal Reserve off guard, which was at the time still trying to combat runaway inflation (inflation that resulted partly from misguided political pressure to keep interest rates low).
What subsequently occurred was stagflation, which was high inflation, slow economic growth, and more severely the punishment of the highest energy prices on record despite higher interest rates.
What resulted was a stock market crash not seen since the Great Depression of the 1930s. The S&P 500 lost 43% within a year which was a situation not revisited until the Great Financial Crisis in 2008.

Key Takeaway #1:
In laying out what happened between 1973-1974, there appears to be notable similarities to 2021-2022:
- The Fed was misguided by inflation expectations, and kept interest rates too low for too long following the Covid recession.
- Officially, the Fed initially thought that high inflation was ‘transitory’, only to backpedal on that narrative late 2021.
- The Ukraine-Russian conflict resulting in stubbornly high oil prices was something totally unexpected, and not factored into the Fed’s policy playbook.
- At the time of writing this article, the Fed has not made any moves to raise interest rates, although they have sounded markets that they will begin to raise rates in 2022.
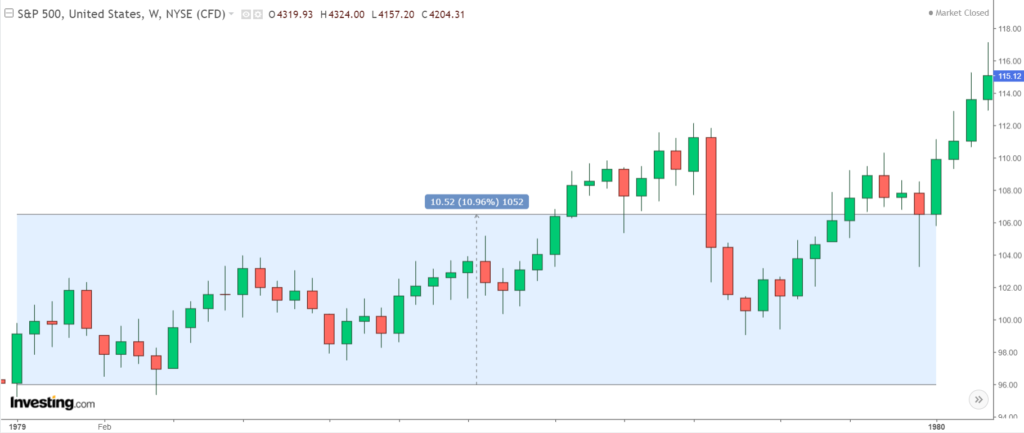
What happened in 1979?
The Iranian revolution of the 1979s showed a totally different template from 1973-1974.
While oil prices rose rapidly in conjunction with interest rates, the stock market was not hit particularly hard.
The headline news of the day was almost unforgettable, with US pump prices passing $1 gallon for the first time in history.
Similar to the current situation, the US also imposed an embargo on Iran.
So what resulted was an exact similar playbook, the Fed was sprinting to catch up and fight inflation by aggressively increasing interest rates, as the then president Jimmy Carter chose a hawkish new chairman.
However, what was materially different between 1973 and 1979, was that the S&P 500 returned 11% in 1979, which was within range of the inflation rate at that time, despite the rallying oil price and aggressive interest rate spikes.

What could explain the difference?
Why did the S&P 500 behave so differently comparing 1973/9174 to 1979?
Afterall, both periods suffered from high inflation and escalating oil prices.
However, why did the S&P 500 rally 12% in 1979, but lost more than -40% between 1973 to 1974?
There are 3 main reasons, of which the third is arguably the key one to look out for.
First, the economy was hit harder in 1974 compared to 1980, contracting half as much compared to the end of 1980, while the recession lasted more than twice as long.
Second, stocks were definitely not cheap in 1974, trading in line with their valuation averages since 1881, based on Shiller’s Price Earnings (PE) measure. In 1979-1980, they stock market was significantly below their long term average.
Key Takeaway #2:
The third main reason why the S&P 500 in 1979 behaved significantly different from 1974, was because the financial market at that time appreciated the innovative strategy presented by the then Fed Chairman, Paul Volcker.
In 1979, Paul Volcker the newly minted Fed Chairman proposed a new strategy for conducting monetary policy to fight inflation, which was much cheered by the financial markets of the day.
That day on Wall Street itself, the Dow rallied a then record 35.34 points gain on the NYSE with a significant volume of 50.45 million shares.
What the stock market valued was that the Fed stated they would no longer seek to control the level of interest rates, but would concentrate on slowing the money supply growth.
What our readers need to appreciate with regard to that historical context, was that by the late 1970s, the world economy was losing faith in the US dollar and to make matters worse, inflation was rampant.
Volcker therefore had 2 twin goals with his new strategy, which was to reduce inflation and strengthen the dollar by directly slowing money supply.
Key Takeaway #3:
When the Fed gives better than expected monetary policies, historically they have been very well received by the stock market.
In fact, in 2020, because of Covid, the Fed once again gave the financial market more than what it had expected.
Conclusion
It has come to the most important part of the article – in view of the current situation, what must the Fed do to calm markets? Most importantly, even if the economy were to enter into recession in the not so distant future, what might cause the stock market to remain resilient?
First, if the Fed were to take a wait and see approach, particularly if it signals that the recent Russian-Ukraine conflict while adding new risks to inflation via oil prices, is also creating more uncertainty towards the economy, and therefore wishes to retain its pre-conflict interest rate hike path, it might not be well received by the stock market.
The reason is simple, the financial market is clearly very concerned over inflation and how the high oil prices will not help matters. A wait and see approach may be treated as underwhelming for stock traders and investors, and may result in further declines in the stock market.
On the other extreme, what may be bullish for the stock market, is the counter-intuitive side of the argument. The Fed will need to acknowledge the seriousness and severity of the inflation issues and the added stress created by the Russian-Ukraine conflict.
They then need to communicate to the market, more than what would be typically expected. Some possibilities may include:
- The Fed must provide what is a ‘neutral rate’ that is neither bullish nor detrimental to the economy. This ‘neutral rate’ has so far not been defined by the Fed.
- The Fed then needs to set the target rate above what this neutral rate happens to be. This signals the Fed’s determination and aggression to fight inflation.
- Front loading more rate hikes in earlier cycles may also be well received.
- The Fed may also need to provide clarity on what liquidity/financial metrics they are monitoring to ensure financial credit stresses will not occur as a result of these tightening measures.
- Finally, the Fed may also need to signal a path to normalcy. This is to give assurance to financial markets their plans to fight inflation are short to medium term, rather than being a long term issue (not what the market is expecting).
Please note that all the information contained in this article is intended for illustration and educational purposes only. It does not constitute any financial advice/recommendation to buy/sell any investment products or services.


